


The Worst is Yet to Come
Back in March, I predicted the usual seasonal reductions in delinquency that occur in the 1st quarter of every year. Well, The National Credit Union Administration (NCUA) just released their aggregate credit union 5300 FPR financials report for Q1 2025 and I’ve got good news and I’ve got bad news. The good news is, they did come down from Q4 2024. The bad news is, not enough to give any hope for a better 2025.
–
–
Portfolio Balances: The Long Slow Slide
While the Fed cut prime rates twice in 2024, they haven’t even suggested a cut this year. And with the captives and big banks continuing to dominate in new auto loan originations, we’re seeing a long slow slide. Traditionally, Q1 is a big auto buying season and this year was no different with the shrinking credit union auto loans portfolios only shrinking by $10.9M. This was significantly better than I thought it would be.
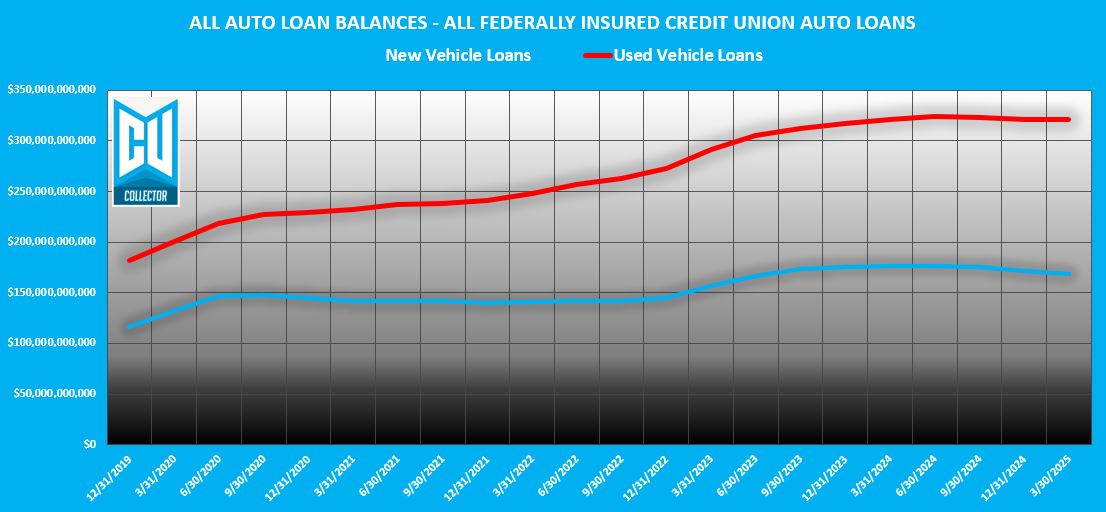
This is actually a significant improvement but was done solely by used car loans which grew by $1.52B and new car loan balances shrunk by $1.53. This shift in the portfolio will weigh heavy on future combined delinquency and losses as used performs worse than new.
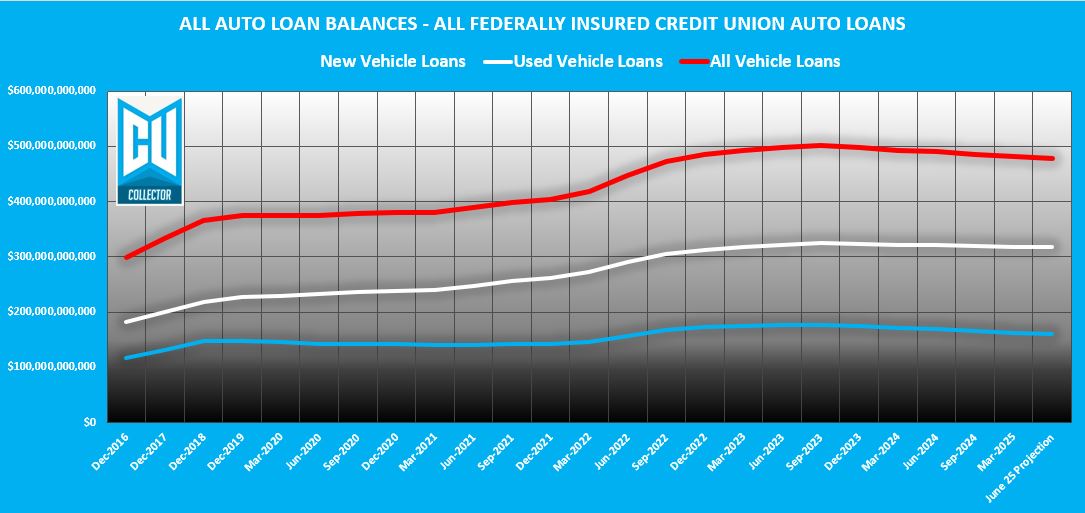
Long gone are the good old days of a 4% annual increase in portfolio balances as experienced for five straight years. The runoff has begun and the end is nowhere in sight. I predict Q2 2025 will see another 1% reduction, landing at $478B. It hasn’t been that low since September of 2022.
–
30-Day Delinquencies: A Mounting Challenge
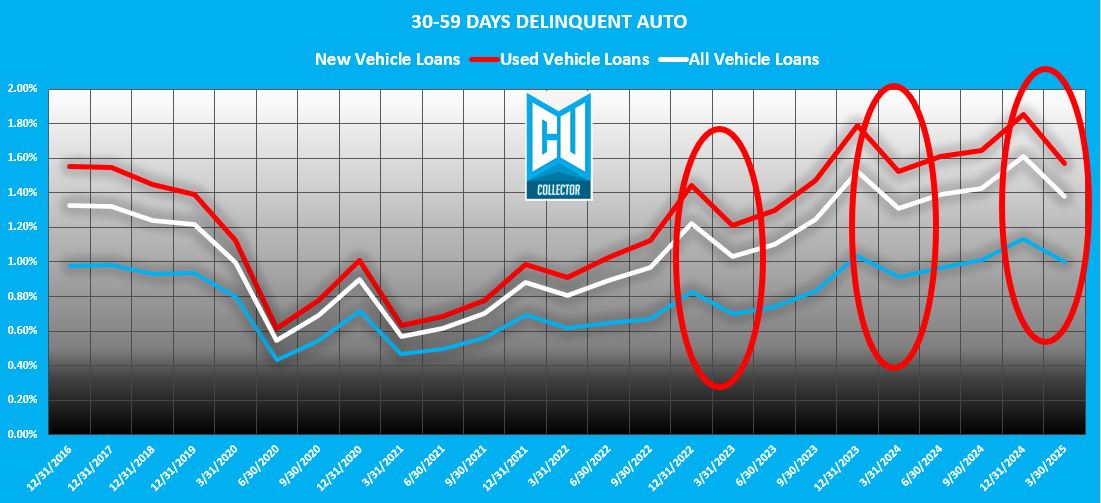
Q1 2025 30-day delinquency finished worse than the $6.3B I predicted. Finishing at $6.6B with a solid reduction of $14B (-.23%) was unfortunately higher than 2024’s Q1 finish of $6.4B. This matters a lot. This is usually the best quarter for delinquency reductions and if year over year it rises, the end of the year will likely be worse than the one before.
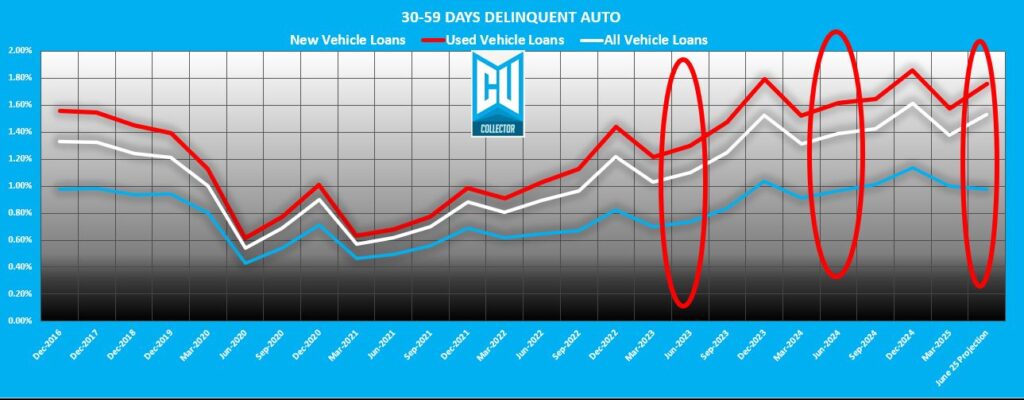
I predict a spike in 30 day delinquency for the end of Q2 with a finish of $7.3B. That a huge $698M increase. Remember, what rolls past this level tends to roll through to repossessions and charge off by a very high ratio.
–
60+ Day Delinquencies: The Main Stage
Overall, the reportable 60+ day delinquency was the best since Q2 of 2023. Finishing at $3.8B and a 0.95% ratio, the largest reductions occurred in the 60-89 day used auto bucket. As good as this is, it is only 0.02% lower than Q1 of 2024.
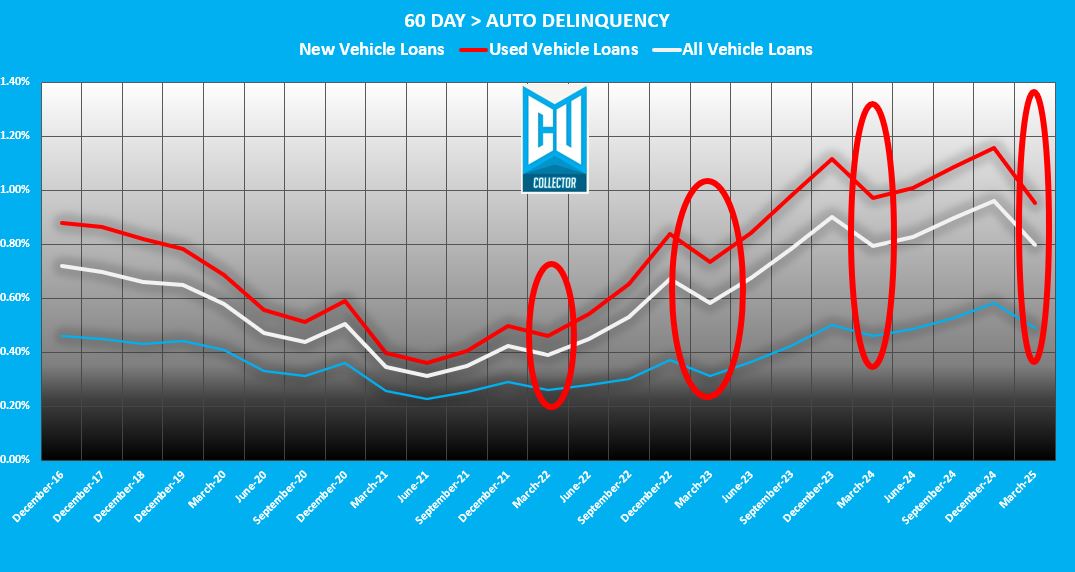
This was a $790M reduction. Good, right? Kind of, but I’ll get to that later.
Q2 usually sees a 10% increase and I predict it’ll end at $3.3B, a $200M increase. Now, keep in mind, this is ALL auto loan delinquency over 60 days, clear up to 360 days plus and over 180 days delinquent, the numbers barely budge unless charged off.
–
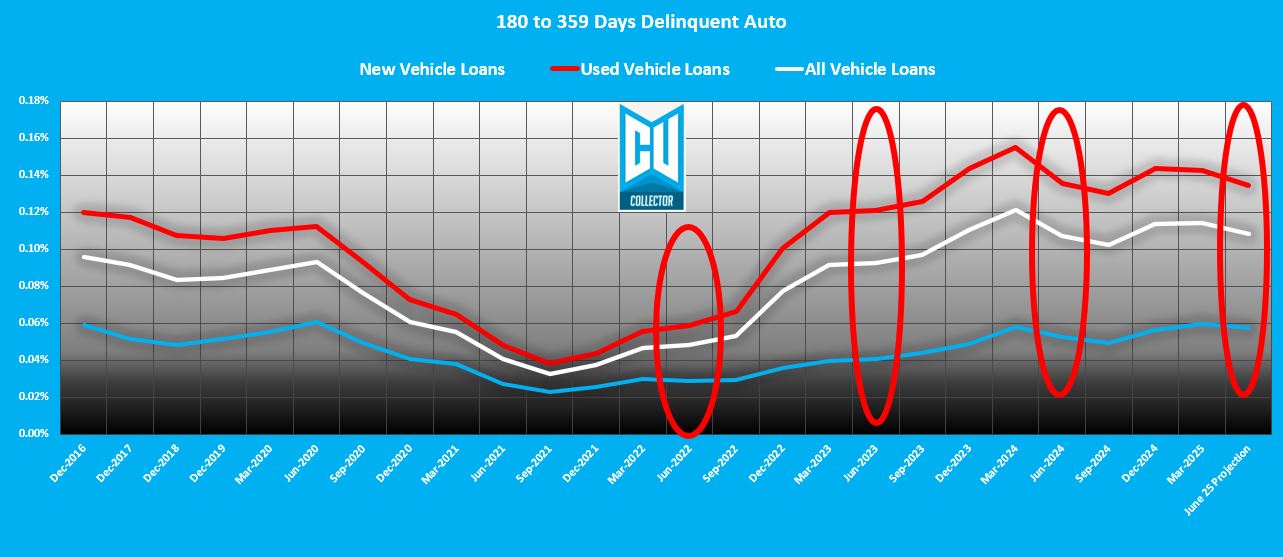
180+ Days Delinquent: The Bone Yard
The 180+ day bucket, filled with Bankruptcies, repos, and deficiencies are the bulk of this tranche. Reaching $532M in Q1 2025, they showed a measly reduction of $2.8M from Q4, but are $38M lower than they were in Q1 of 2024.
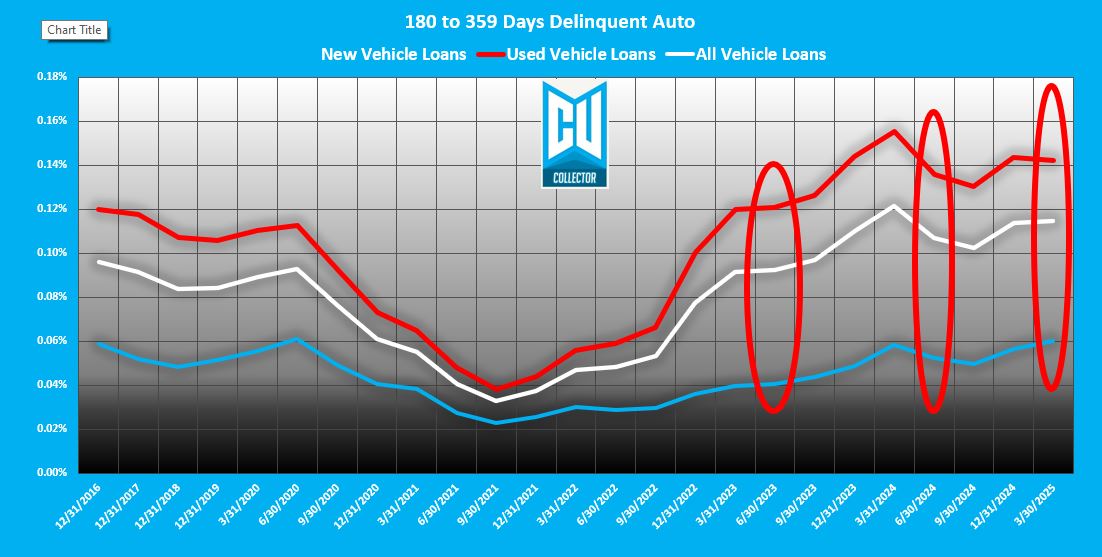
I suspect that this reduction will actually be bigger in Q2 and finish at $511M. But the reason for this is not pretty and I’ll get into that next.
–
Charge-Offs: The Tide Remains High
Q1 2024 Charge-offs opened the year at $1.45B. Remember, charge off is aggregate for the year and grows quarter by quarter until the start of a new year. Q4 is always the biggest charge off quarter of the year and in this quarter of 2024, the industry charged-off $1.43B.
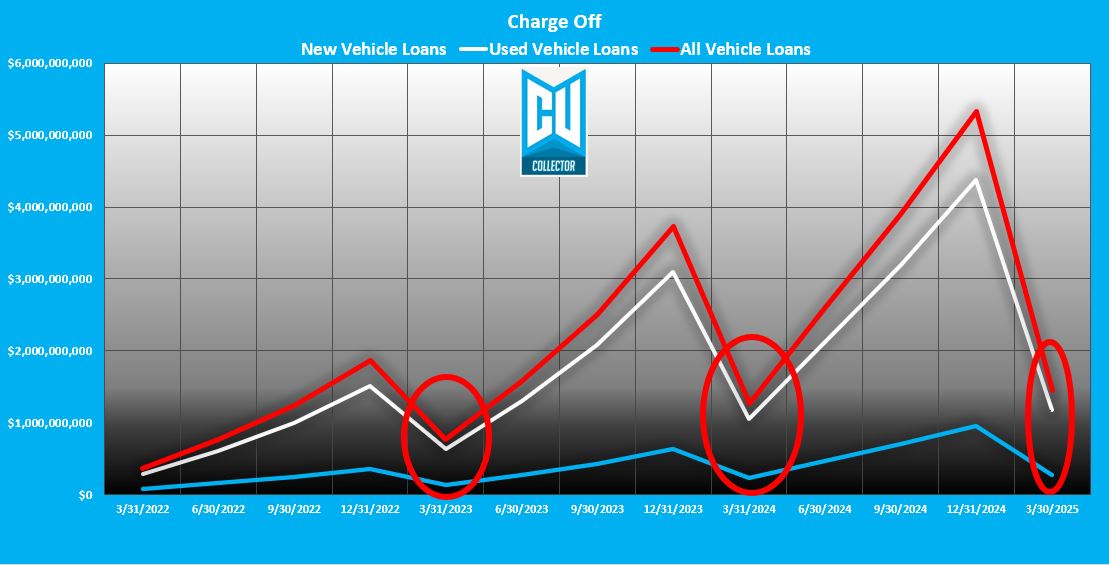
So, in essence, Q1 of 2025 was worse for charge off than Q4 of 2024. The industry charged-off $1.4B but the reportable delinquency only went down $790M.
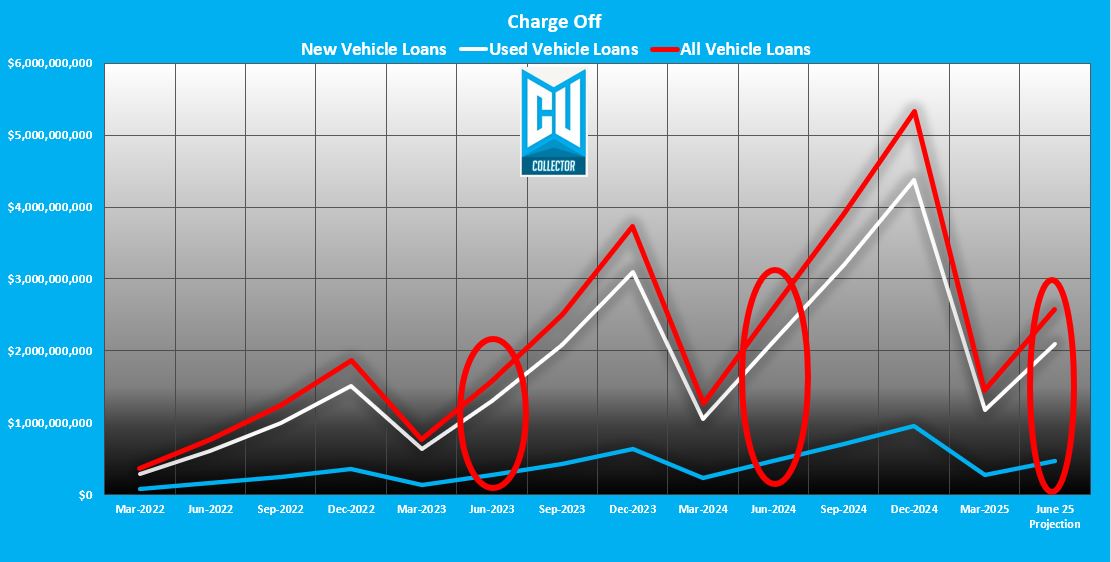
I predict this trend continues and Q2 charge-off ends at $2.6B YTD. And that’s a modest prediction. I suspect it will be fed heavily by the 180+ bucket.
–
Loan Modifications: Extend and Pretend
Loan modifications (TDRs) are the highest they’ve been since March of 2020! A total of $7.7B in loan balances have been reported as “Outstanding Troubled Debt Restructured loans or Modifications to Borrowers Experiencing Financial Difficulty”. This is worse then what the usual peak is in Q4 and 2024 was a big one too.
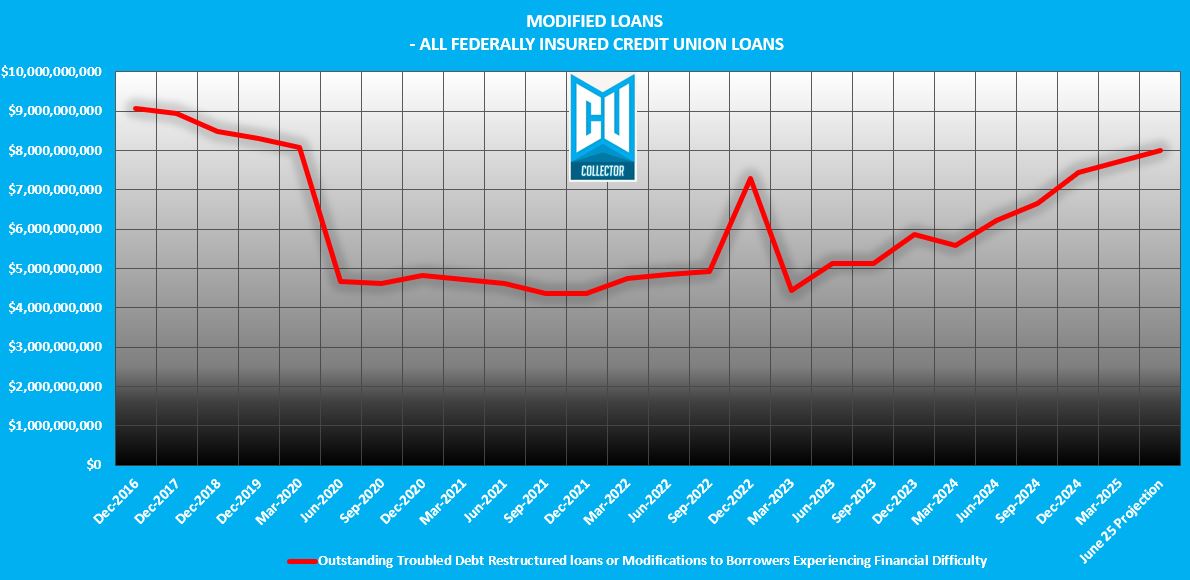
While not all of these are auto loans, their break down is not reported, so there is no way to tell. But it’s safe to assume that a large portion of these are auto loans and most credit unions don’t report extensions as TDR’s, so lets be honest, there are a ton of extensions being done to suppress this delinquency.
I don’t see this getting any better. I suspect we’ll see it climb to $8B by the end of Q2.
Back in February I posted an article titled; “Are Lenders Masking the True State of Auto Loan Delinquency?” authored by, Principal Owner of Commercial and Consumer Auto Finance Industry Knowledge, Bill Ploog. In his article, he demonstrated a strategic delay in repossessions and an increase in loan modifications by lenders to hold the line in charge offs and delinquency.
Don’t feel bad. Bill Ploog just shared data from April’s SEC filings that showed 44% of all Ally Financials Asset Backed Secured (ABS) publicly sold have at least one loan modification and of the 18 lenders in this market, most are well above 22%.
It appears that this “extend and pretend” strategy has been employed aggressively with poor results. With repossession volumes as high or higher in 2025 as they were in 2024, it appears as though there are fundamental problems under the hood of everyones auto loan portfolios and collections practices.
–
The Bottom Line
Q2 is pretty much in the bag, so most of you are probably experience something similar to what is being reported already. With Q3 just around the corner, there is no expectation of relief in sight.
Rate cuts, inflation, tariffs, inflation, GDP; these are all wildcards in the future, but so far, it’s not looking like there is a light at the end of the tunnel. Buckle up if you haven’t already. It looks like the worst is far from over.
Download the Data Here!
–
Stay vigilant,
Kevin Armstrong
Publisher
–
Related Articles;
Q4 2024 Credit Union Auto Loan Delinquency – An Ugly Year
The Calm Before the Storm – 1st Quarter 24’ Credit Union Auto Loan Delinquency
Credit Union Auto Loan Delinquency Climb Continues
Credit Union Auto Loan Delinquency Surges
Credit Union Auto Loan Delinquency Pattern Back to Normal
Q1 2025 Credit Union Auto Loan Delinquency – Buckle Up Buttercup – Q1 2025 Credit Union Auto Loan Delinquency – Buckle Up Buttercup – Q1 2025 Credit Union Auto Loan Delinquency – Buckle Up Buttercup – Q1 2025 Credit Union Auto Loan Delinquency – Buckle Up Buttercup – Q1 2025 Credit Union Auto Loan Delinquency – Buckle Up Buttercup
Q1 2025 Credit Union Auto Loan Delinquency – Buckle Up Buttercup – NCUA – Delinquency – Lending – Credit Union Collections – Credit Union Collectors – Repossession – Wholesale – Auto Loan


More Stories
Identity Theft, Fake Pay Stubs, and Nearly $69,000 in Fraudulent Loans
Former Credit Union Loan Officer Admits Identity Theft in $100,000 Vehicle Fraud Scheme
The Psychology of Fraud: Where Fear, Greed, and Opportunity Collide