


How Aging Vehicles, Mechanical Inflation, Insurance Costs, and Recovery Dynamics Are Reshaping Portfolio Performance
–
Executive Summary
The U.S. Auto Finance market is entering a new phase of the Credit Cycle — one defined not only by rising borrower stress, but by structural changes in collateral performance and recovery economics.
As affordability constraints push consumers toward older vehicles with longer loan terms, lenders are increasingly exposed to risks that extend well beyond origination.
These risks are emerging most clearly within Servicing and Recovery operations.
This is where early indicators of portfolio stress begin to appear.
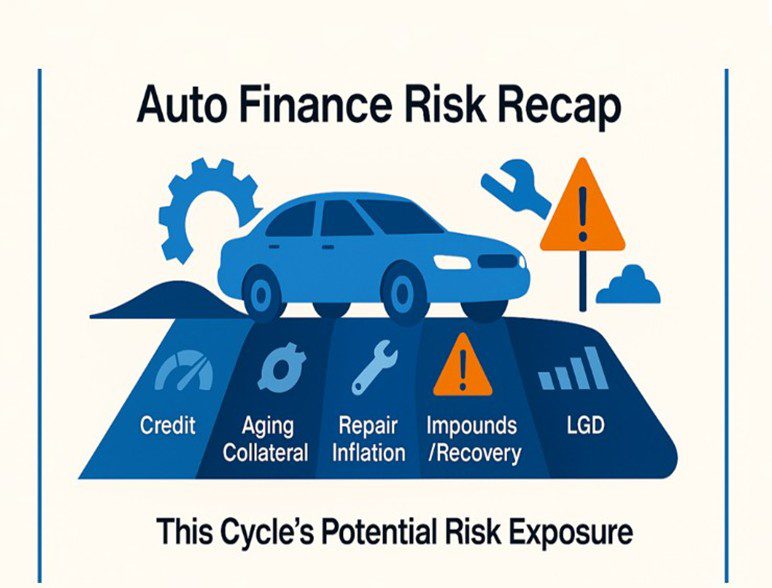
Throughout this Risk Series, multiple forces have been converging:
- Aging collateral increasing mechanical failure risk
- Mechanical repair inflation elevating borrower stress and loss formation
- Rising insurance costs reducing affordability and increasing loss complexity
- Recovery pressure weakening liquidation outcomes and increasing loss severity
Individually, these pressures are manageable.
Together, they are reshaping Portfolio Performance, Recovery Rates, and Return Outcomes.
1. Structural Shifts in Used Vehicle Lending
Over the past several years, three changes have reshaped auto finance:
- Rising vehicle prices pushing consumers into used vehicles
- Extended loan terms (72–84 months becoming common)
- Older vehicles at origination (often 5–7 years old)
This creates a structural shift in portfolio composition.
Many financed vehicles today will be 11–14 years old by loan maturity — well beyond traditional reliability windows.
This fundamentally changes the risk profile of the collateral.
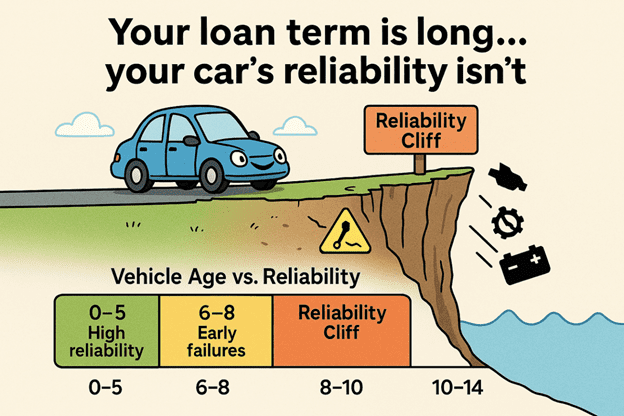
2. The Vehicle Reliability Cliff
One of the most underappreciated drivers of auto loan performance is what can be described as the “Vehicle Reliability Cliff“.
This refers to the point — typically between 8–10 years of vehicle age — where:
- Mechanical failure rates increase
- Repair frequency and costs rise
- Reliability declines
The Structural Mismatch
Loan Terms are extending while Vehicle Reliability declines, driving an increase in Mechanical Failures and Borrower Stress.
Modern loan structures amplify this risk:
- Vehicle age at origination: 5–7 years
- Loan term: 72–84 months
- Vehicle age at maturity: 11–14 years
This creates a fundamental disconnect.
Borrowers often still carry meaningful loan balances at the exact point when vehicles become least reliable.
Borrower Behavior Under Repair Stress
When major repairs hit — often $3,000–$6,000+ — borrowers face a tradeoff:
- Repair the vehicle
- Continue making loan payments
In many cases, they cannot do both.
This leads to:
- Payment disruption
- Rising Delinquencies
- Voluntary Surrenders and Repossessions
Subprime borrowers are feeling these pressures most acutely, with thinner financial buffers, older collateral, and higher sensitivity to Repair and Insurance shocks.
This is the point in the loan lifecycle where borrower stress begins to surface operationally, long before traditional credit indicators show deterioration.
Why This Risk Is Missed
Most credit models focus on:
- Credit Score
- Debt-to-Income
- Payment History
They rarely account for the interaction between loan structure and vehicle reliability over time.
As a result, this risk appears later — in Servicing Performance, not Origination Data.
3. Mechanical Inflation and Early Loss Formation
Mechanical Repair costs have increased materially:
- Labor rates are higher
- Parts are more expensive
- Diagnostics are more complex
Repairs that once cost ~$1,500 now frequently exceed $3,000–$6,000+.
The Behavioral Shift
When vehicles break down today, outcomes are different:
- More borrowers cannot afford repairs
- Vehicles are more likely to be towed
- Impound events are increasing
Mechanic’s Lien Risk
A critical but under-modeled scenario:
- Borrower approves repair
- Work is completed
- Borrower cannot pay
The repair shop files a mechanic’s lien, forcing the lender to decide:
- Pay to protect the collateral
- Or walk away if the economics no longer work
Delays increase the risk of losing the asset entirely.
Where Losses Begin
Losses are no longer triggered solely by default.
They begin earlier through:
- Repair-driven stress
- Impounds
- Operational decision points
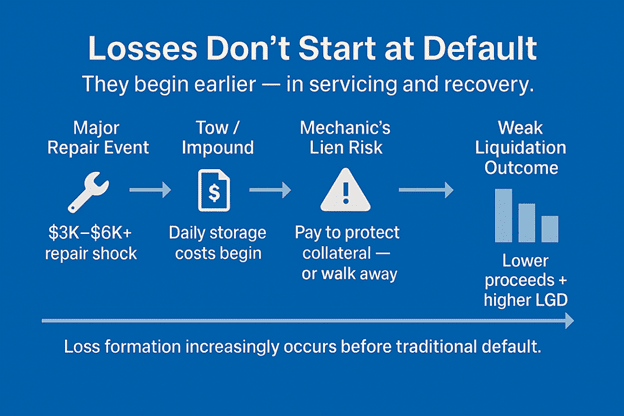
Losses increasingly form upstream through Repair Shocks, Impounds, and Lien Decisions long before a traditional default.
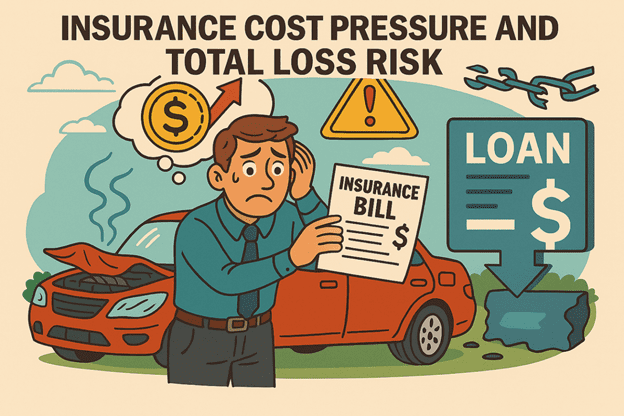
4. Insurance Cost Pressure and Total Loss Risk
Another accelerating pressure point in Auto Finance is the rising cost of vehicle insurance — and its downstream impact on both borrower behavior and loss outcomes.
Insurance premiums have increased materially in recent years, driven by:
- Higher repair costs
- Increased vehicle complexity
- Elevated accident severity and claim costs
For many borrowers — particularly in subprime segments — insurance is no longer a fixed background expense.
It is a growing component of total monthly cost.
Affordability and Payment Tradeoffs
As insurance costs rise, borrower budgets tighten.
This creates a tradeoff:
- Maintain insurance coverage
- Continue making loan payments
In many cases, borrowers cannot sustain both.
This can lead to:
- Lapsed or reduced insurance coverage
- Increased payment stress and delinquencies
- Higher overall portfolio risk
Impact on Total Loss Frequency
At the same time, rising repair costs, elevated LTVs, and longer loan terms are reducing the margin between repair cost and ACV — pushing more vehicles into total-loss territory.
Older vehicles are especially vulnerable because they have:
- Lower market value
- Higher repair cost relative to value
As a result, a growing share of claims are being classified as Total Losses rather than repaired.
Severity and Deficiency Risk
When a Total Loss occurs:
- Insurance proceeds are paid based on vehicle value
- Outstanding loan balances may exceed settlement amounts
This creates a Deficiency Balance.
For borrowers without GAP coverage, this often results in:
- Immediate financial strain
- Increased likelihood of default or charge-off
Key Insight
Rising insurance costs are accelerating loss frequency and loss severity, with subprime portfolios feeling the sharpest impact.
Insurance Inflation is now interacting with Mechanical Inflation, creating a second affordability shock for many borrowers.
Rising Insurance Costs and elevated Total-Loss exposure are increasing borrower strain and contributing to Portfolio Stress.
5. Servicing as the First Signal of Stress
The earliest indicators of stress are not found in origination data — but in servicing.
Key events include:
- 60+ Day Delinquencies
- Bankruptcies
- Repossessions and Voluntary Surrenders
- Insurance Total Losses
- Impounds
- Remarketing Losses
Impounds as a Leading Indicator
Impounds are often overlooked — but increasingly important.
They introduce:
- Daily storage costs
- Time-sensitive recovery decisions
- Deteriorating collateral condition
In some cases:
Costs exceed recoverable value, forcing lenders to abandon the asset entirely.
Impounds represent early-stage loss formation and growing operational complexity.
6. Recovery Pressure and Expanding Loss Severity (LGD)
Loss Severity is increasingly driven by Recovery Dynamics, not just Default Rates.
Aging Collateral Impact
- Lower and Less Predictable Auction Values
- Greater Condition Variability
- Reduced Reconditioning Efficiency
Cost Layering Before Sale
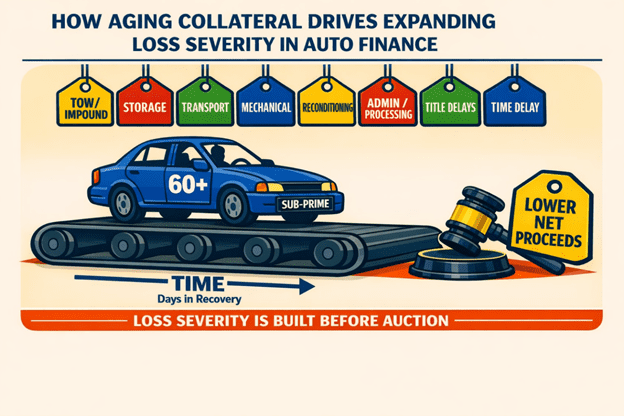
Loss Severity is increasingly built upstream through Aging Collateral and cumulative Recovery Costs.
Before liquidation, costs accumulate:
- Towing and Repossession
- Impound and Storage Fees
- Delays Extending Days-to-Sell
- Recovery Execution Friction
In recovery, Time directly impacts both Cost and Proceeds.
Remarketing Challenges
- Thinner demand for older vehicles
- Greater pricing dispersion
- Uncertain return on reconditioning
The Financial Outcome
Lower Proceeds + Higher Costs = Higher Loss Severity (LGD)
This flows directly into:
- Larger Charge-Offs
- Increased Deficiencies
- Reduced Portfolio Returns
7. Portfolio Performance and ROI Compression
Even modest changes in key metrics can significantly impact performance:
- Higher Delinquencies
- Increased Charge-Offs
- Lower Recovery Values
The result:
- Margin Compression
- Reduced Investor Returns
- Increased Performance Volatility
8. The Emerging Credit Cycle (2026–2028)
The next phase of the cycle is already forming within current portfolios, particularly 2021–2024 vintages.
Over the next several years:
- Loans move into late-stage performance windows
- Vehicles age beyond reliability thresholds
- Recovery events increase in a normalized market
What Makes This Cycle Different
This cycle may not be defined by a spike in defaults.
Instead, it may be defined by:
- Higher loss severity
- Weaker recoveries
- Greater dispersion between lenders
9. Bankruptcy as the Converging Risk Layer
While much of the focus in Auto Finance remains on Delinquency and Repossession activity, another outcome is likely to become more visible as these dynamics evolve: Bankruptcy.
Bankruptcy is not an isolated risk factor — it is often the result of the same pressures outlined throughout this series.
As vehicles age, repair costs increase, and borrower liquidity tightens, consumers face a narrowing set of options.
Negative equity, declining collateral value, and limited refinancing alternatives further constrain borrower flexibility.
In this environment, bankruptcy becomes a release valve.
For lenders, this introduces additional complexity:
- Extended resolution timelines
- Legal and servicing costs
- Reduced control over collateral outcomes
- Increased loss severity and deficiency risk
Importantly, bankruptcy can delay or disrupt traditional recovery strategies, creating further pressure on portfolio performance.
10. Combined Impact: How These Risks Converge in Portfolio Performance
Individually, each of these risk factors can be modeled, monitored, and managed.
However, the defining characteristic of the current environment is not any single pressure point — it is the interaction between them.
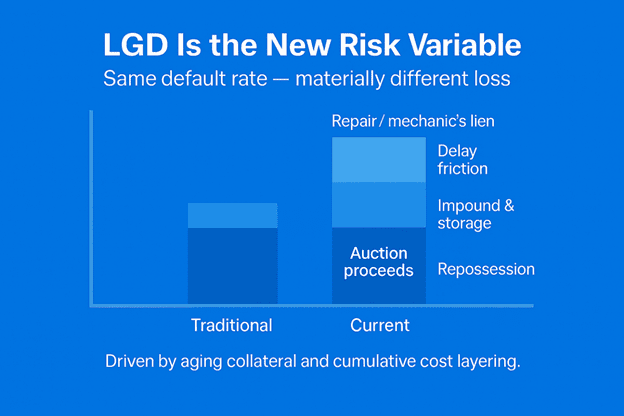
Today’s Loss Severity is driven by cumulative cost layering — even when default rates remain unchanged.
As portfolios season, these dynamics do not occur in isolation:
- Aging vehicles increase the likelihood of mechanical failure
- Mechanical failures introduce repair shocks and borrower stress
- Rising insurance costs further compress borrower liquidity
- Coverage lapses and repair economics increase total loss probability
- Impounds and recovery delays introduce time-based cost friction
- Recovery outcomes weaken as collateral condition declines
- Bankruptcy emerges as a downstream resolution path
The Compounding Effect
These interactions create a compounding impact across the loan lifecycle:
- Earlier onset of borrower stress
- Faster migration into delinquency
- Increased frequency of loss events
- Higher cost to recover collateral
- Lower recovery proceeds
- Expanded deficiency balances
From Credit Cycle to Performance Dispersion
In prior cycles, performance was largely driven by default rates.
In this cycle, performance may be increasingly driven by:
- Loss Severity (LGD)
- Recovery Execution
- Operational Decision-Making Speed and Effectiveness
Portfolio-Level Implications
At the portfolio level, this convergence results in:
- Elevated Charge-Off Rates
- Lower Recovery Ratios
- Increased Volatility in Performance
- Compression in Risk-Adjusted Returns
Key Insight
This is not simply a credit cycle.
It is a full lifecycle performance shift, where Credit, Collateral, Servicing, Insurance, and Recovery dynamics are all contributing to final outcomes.
11. Implications for Investors and Operators
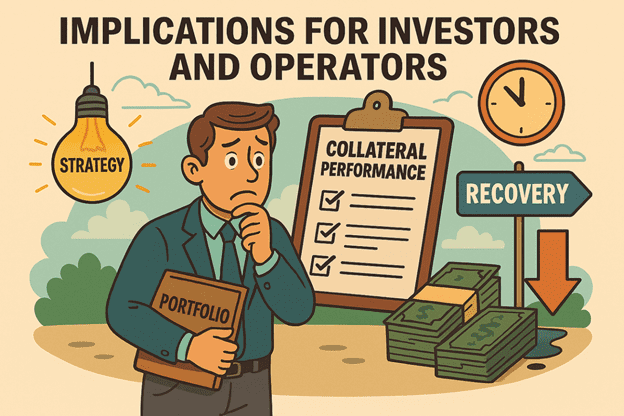
Operational and Strategic implications for Investors and Portfolio Managers in this cycle.
These dynamics have direct implications for how portfolios are evaluated and managed.
This environment requires a broader lens that includes:
- Collateral performance over time
- Recovery timing and cost structure
- Operational execution across Servicing and Remarketing
As Loss Severity becomes a larger driver of returns, areas historically viewed as operational — such as Impounds, Recovery timelines, and Vendor performance — become strategic variables.
The differentiator is no longer just Credit Selection — it is the ability to manage Collateral Performance, Recovery Execution, and Loss Realization across the full lifecycle of the loan.
Closing Thought
The next phase of the Auto Finance cycle will not be defined solely by who avoids defaults —
but by who manages Collateral, Recovery, and Loss Severity most effectively when they occur.
Final Not
As these pressures compound, LGD becomes the clearest lens through which to understand portfolio resilience in this cycle. Lenders who treat recovery operations as a risk function — not a cost center — will be best positioned to navigate what comes next.
I welcome conversations with Investors, Operators, and Peers who are navigating these dynamics or exploring opportunities to strengthen recovery performance — feel free to reach out directly if you’re evaluating similar trends within your own portfolio.
–

Lance Harp
Servicing Solutions – VP, Loss Mitigation | Auto, Lease & Powersport Finance | Risk & Recovery Strategy | LGD, Remarketing & Portfolio Performance
If this perspective adds value to your work:
- 🔁 Share it with peers who are evaluating similar trends
- 🔖 Save it for your next Strategy, Risk Discussion or Portfolio Review
- 🔵 Connect/Follow Lance Harp for continued analysis across Auto, Lease, and Powersport Finance
Auto Finance Risk Series: A Structural Shift in Credit, Collateral, and Recovery – Auto Finance Risk Series: A Structural Shift in Credit, Collateral, and Recovery – Auto Finance Risk Series: A Structural Shift in Credit, Collateral, and Recovery
Auto Finance Risk Series: A Structural Shift in Credit, Collateral, and Recovery – Delinquency – Bankruptcy – Lending – Auto Loan – Credit Union Collections – Credit Union Collectors – Repossession – Repossess – Repossession – Remarketing


More Stories
Former Credit Union CEO Permanently Banned by NCUA for Loan Fraud Exceeding $600,000
Identity Vampires Prey on Vulnerable Elders
Auto Loan Delinquencies Edge Lower in February 2026