


Charge Offs, Bankruptcies and Loan Modifications Peaking Early
–
With Q3 of 2025 almost over, we finally get a chance to review the National Credit Union Administration’s (NCUA) 5300 FPR financials report for Q2 of 2025. And what has been revealed is that 2025 is shaping up to be worse than 2024.
–
Portfolio Balances: Improving But Sluggish
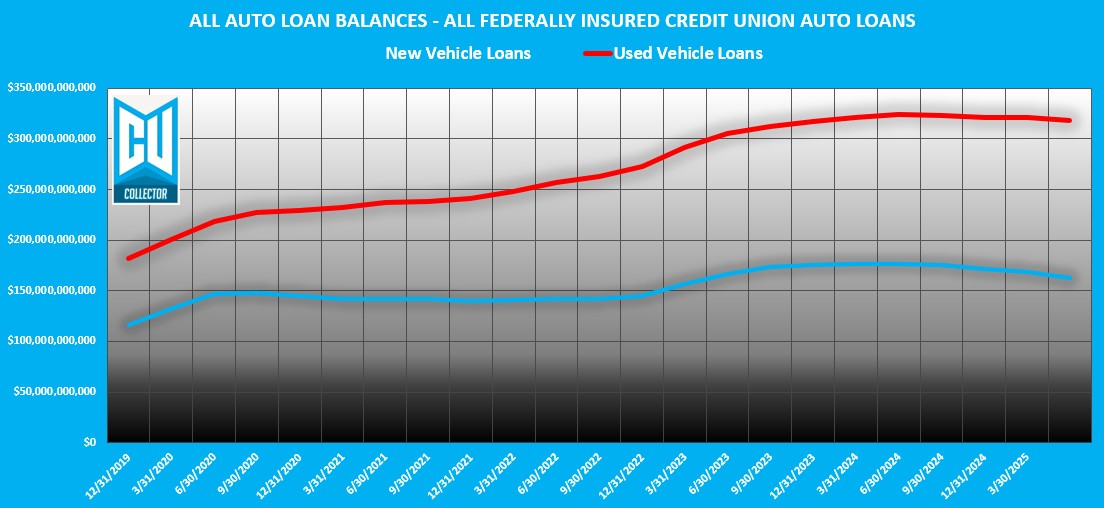
Despite the Fed’s stubborn forecast for inflation due to tariffs credit union auto lending has grown $2B since the beginning of the year. This marks the first signs of growth since Q3 of 2023. Regardless, portfolio balances are still $7B below where they were the same time the year before.
This was far better than the $3B decrease I had predicted in June indicating that consumer activity remains solid.
Unfortunately, this growth, as it was last quarter, was all in used auto, where losses tend to be higher. Credit Unions appear to be have a more difficult time acquiring new car loans as manufacturer rates and rebates are likely too rich to compete with.
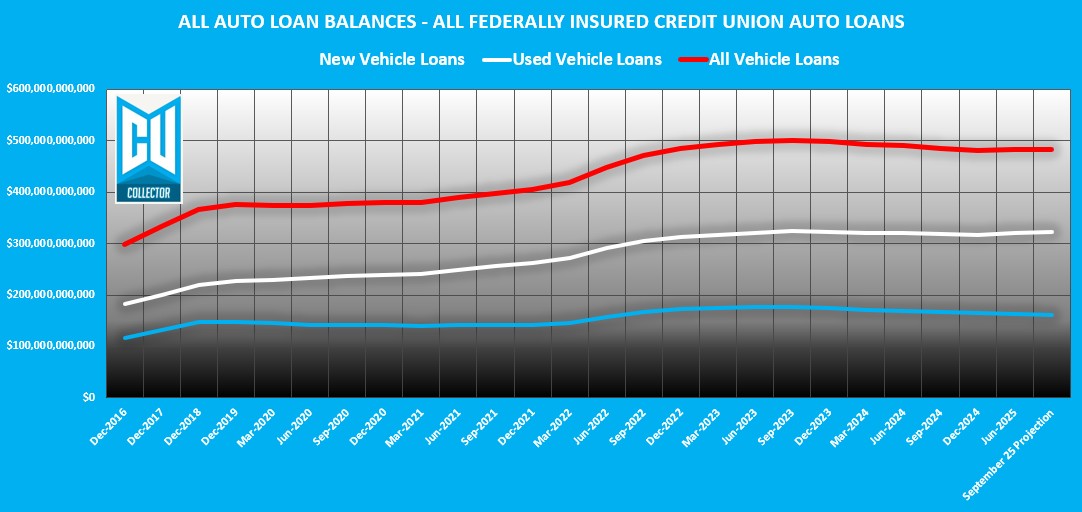
While there is still a remote possibility that the Fed lowers prime rate creating a surge of new loan volume, any likely growth in Q3 that may remain will remain subdued. I predict that the combined portfolio balances will end Q3 at $482B, just $462M higher than at year end 2024.
–
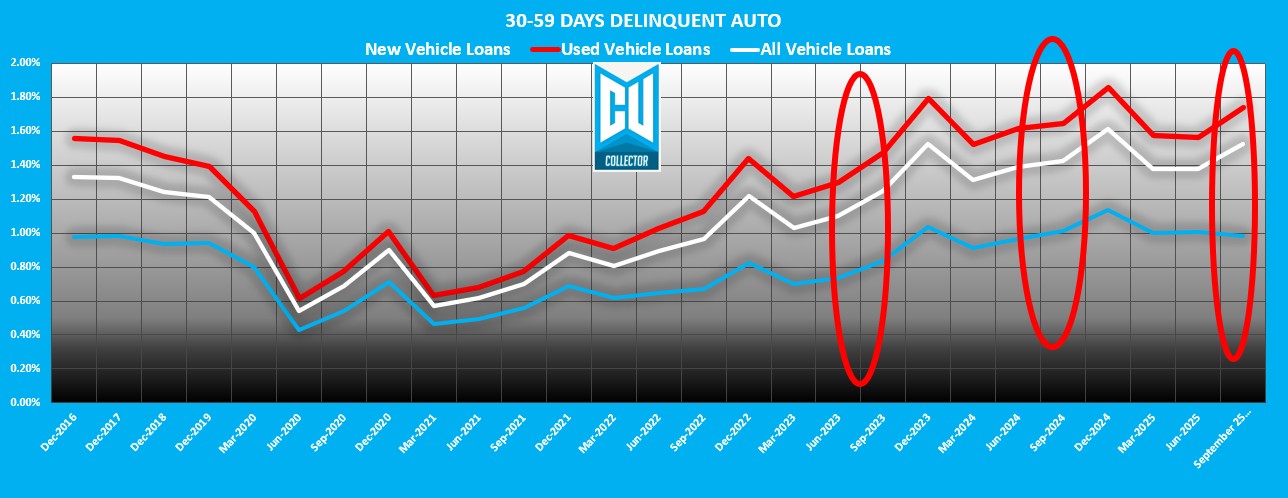
30-Day Delinquencies: Holding the Line
Perhaps most encouraging, the Q2 2025 30-day delinquency bucket finished at $6.6B combined, almost flat from Q1 which finished just $5M lower.
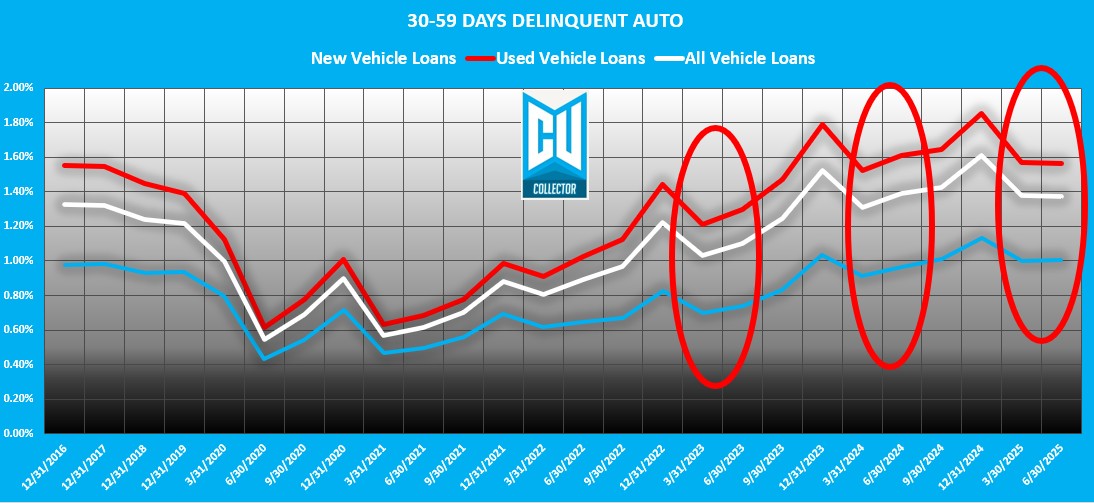
Last June, I predict that we would see a spike in 30 day delinquency for the end of Q2 with a finish of $7.3B. Fortunate for everyone, I was way off. Regardless, seasonal trends on a four year average suggest that the 30 Day Tranche in delinquency will end at 115% of Q2. So, I’m going to double down and predict that Q3 finishes this bucket at $7.3B.
–
60+ Day Delinquencies: The Main Stage
Last June, I had reported that the reportable 60+ day delinquency had finished at 3.8B and was the best since Q2 of 2023. And it was, but the Q2 bump came in and picked it back up to $3.9B, a minor .02% increase quarter over quarter. Not an unreasonable increase, and still the lowest Q2 since 2022.
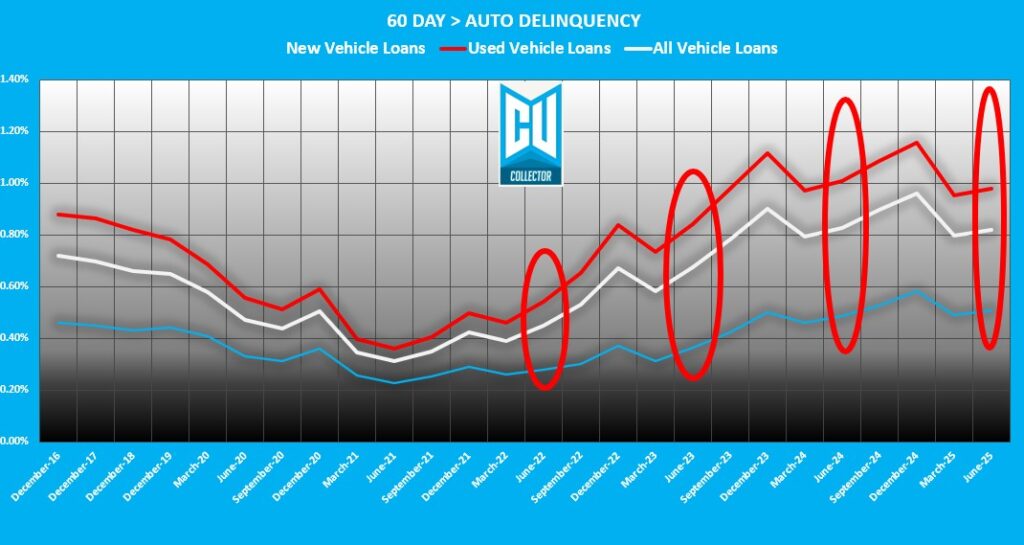
Based on a four year quarterly average, Q3 traditionally shows an 11% increase over Q2. If this seasonal average holds true, we can expect this bucket to finish Q3 at $4.32B. That would represent a $400M increase from Q2, but an actual $30M decrease from Q3 of 2024.
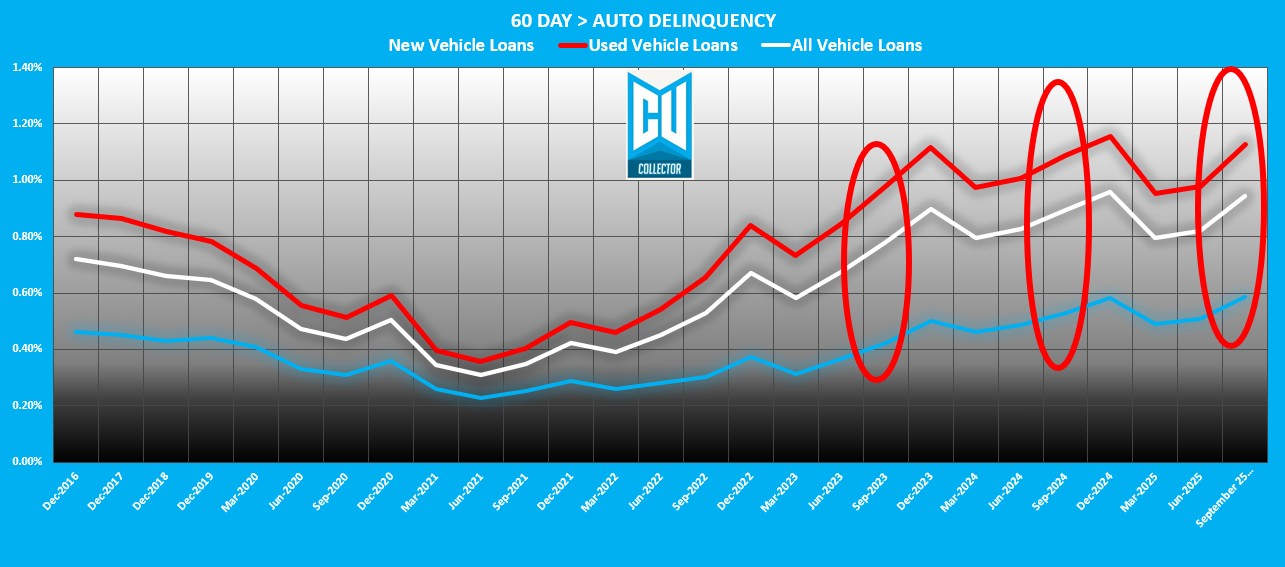
While it is an increase, it does appear as though the line is being held. But keep in mind, this tranche contains ALL auto loan delinquency clear up to 360 days plus. These numbers barely budge unless charged off and it appears as though charge off is playing a major factor in loan delinquency management these days.
–
180+ Days Delinquent: Dead Meat
Bankruptcies, repos, and deficiencies are the bulk of the 180 day+ tranche. But finishing Q2 at $476M, it showed a hefty $76M reduction from Q1 and is actually $86M lower than the same quarter in 2024.
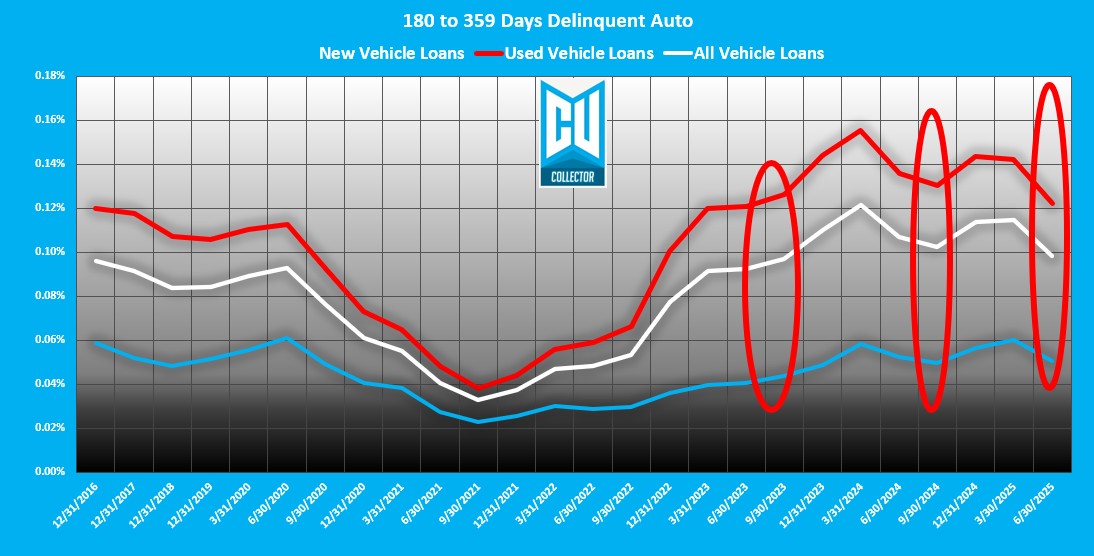
There is actually some reason for optimism here. Using a four-year seasonal average, 3rd quarter delinquency in this bucket historically shows a 3% reduction. If this trend holds water, we can expect to see this 3rd quarter finish at $445M. That would be the lowest in this tranche for any quarter since Q4 of 2022!
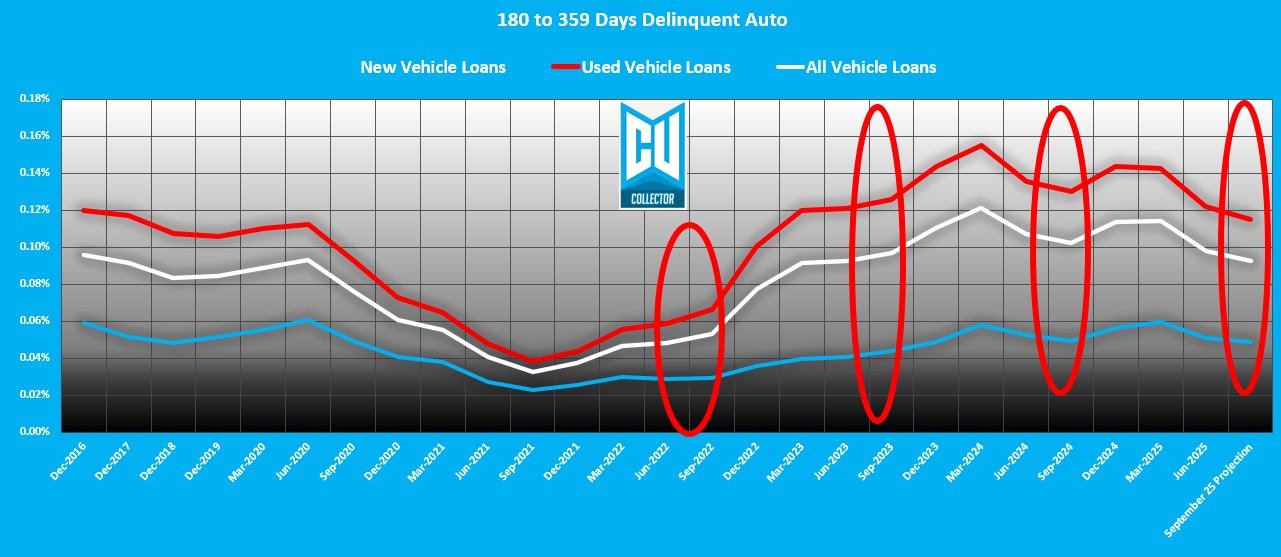
But there is something that appears to be driving these reductions and although it’s a necessary evil, it is not all positive.
–
Charge-Offs: Blowing Out the Year
Does anyone remember in Q4 of last year when year-end aggregate charge-off ended at $5.3M? When it did, the Q2 charge-off was at $2.58B. Q2 of 2025 charge-off just ended at $2.8B. That’s a quarterly increase of $1.3B.
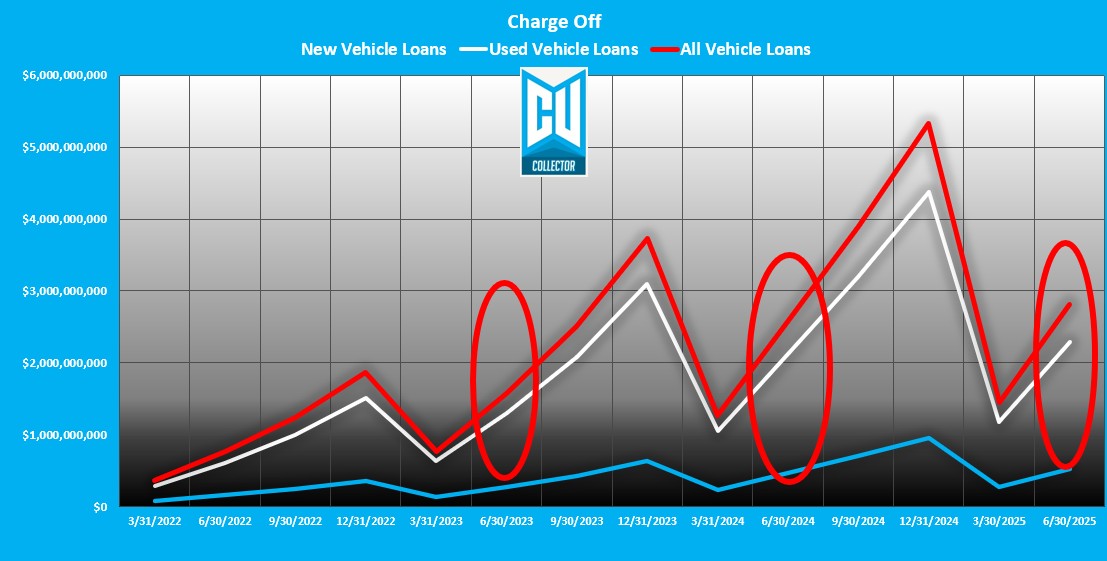
It is important to remember that between Q2 and Q3 of last year, it also increased by the same margin. Q4 of 2024 grew by $1.4B. If this trend holds, 2025’s year end charge-off will exceed 2024.
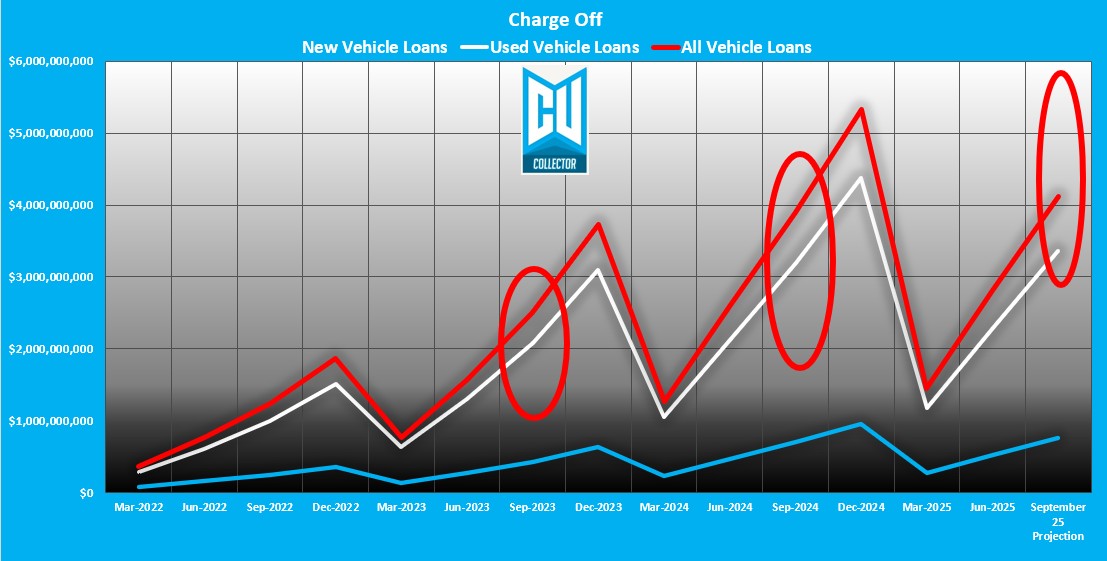
I predict that Q3 auto loan charge-off will finish at $4.1B. A little more than $200M over the same time in 2024. On that note, the year-end charge off will likely grow to a record 5.5B.
This isn’t all bad. I suspect that credit unions are beginning to take a more conservative and realistic approach to charge-off and are being more aggressive in realizing their losses.
–
Loan Modifications: Still Extending and Pretending
As previously predicted, Loan Modifications (TDRs) reached $8B in Q2. Theycontinue to be at their highest level since March of 2020! At mid-year, there was a reported $4.3M in Loan Modifications reported. That is over $877M more than this time last year and $161M higher than it was in year end 2024!
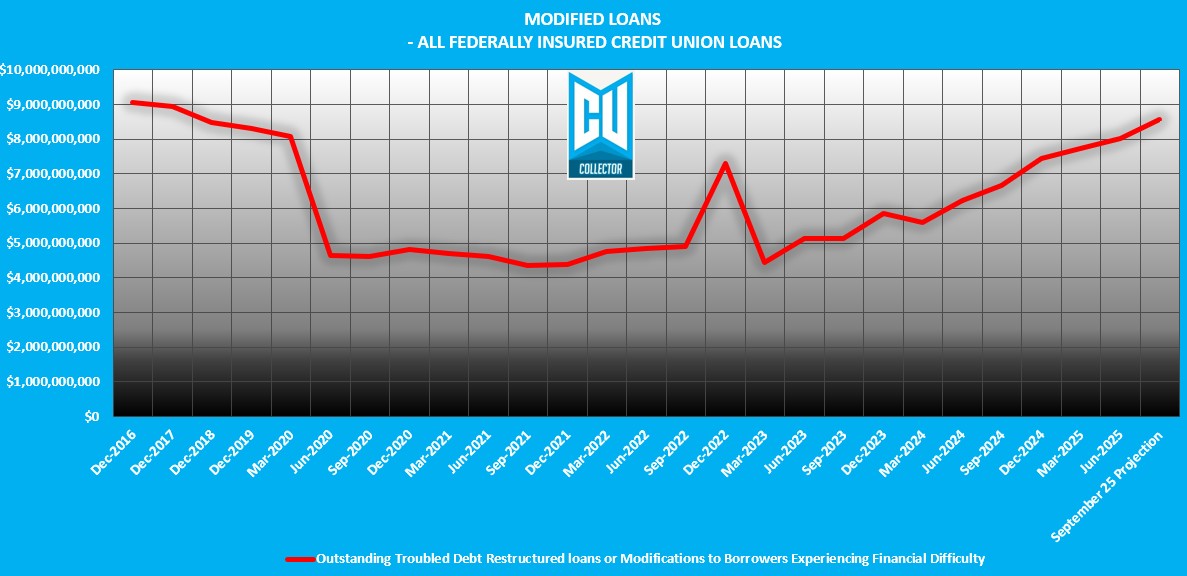
This leniency in loan modifications gives the appearance of “rolling delinquency.” A practice once frowned upon by all Federal bank and credit union Examiners, who seemingly have taken a more liberal mindsight to this strategy.
Of course, not all of these are auto loans, their break down is not reported, so there is no way to tell. But it’s safe to assume that a large portion of these are auto loans and most credit unions don’t report extensions as TDR’s, so lets be honest, there are a ton of extensions being done to suppress this delinquency.
While no one wants to make a borrower suffer, the recidivism rates on delinquency from modified loans tends to be very high. Most of these loans will be back on the delinquency lists in a matter of months.
With these practices climbing in volume, at the current rate of growth we can expect that there will be reported at least $8.3B by the end of Q3 and $8.6B year end.
–
Bankruptcies – The Return of an Old Nemesis
For almost a decade, bankruptcies have been almost a non-issue. And while they are still far below their record years following the Great Recession, they are making a comeback. In Q2, there were a reported $4.3B in reported credit union loan balances reported as in bankruptcy.
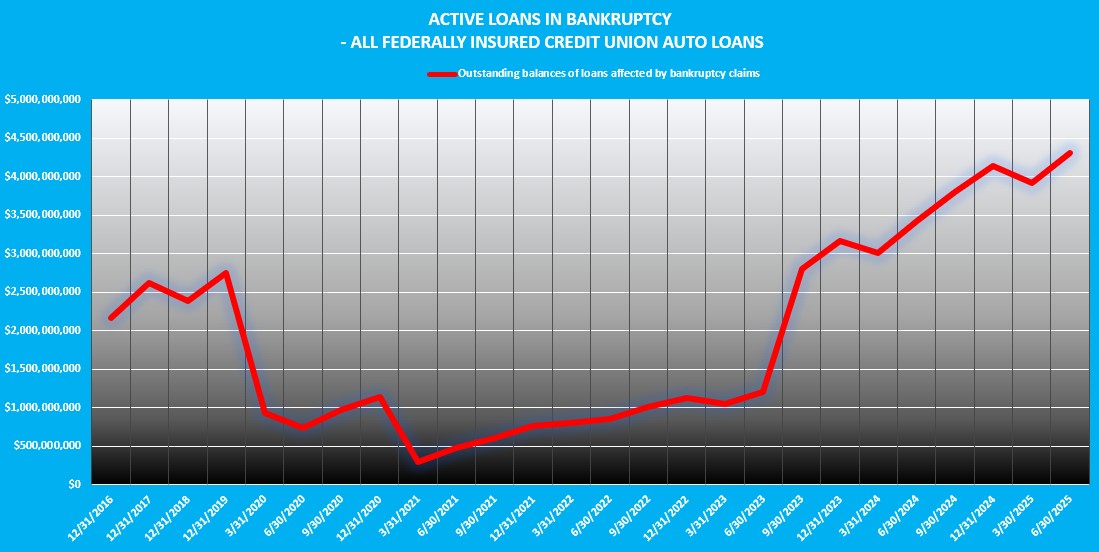
Obviously, these are not all auto loans. But this is a canary in a coal mine for consumer health. With the restarting of student loan payments and rising credit card balances, there is every reason to believe that this is a trend that will not be ending anytime soon.
–
All Signs Say Caution
While delinquency seems to be somewhat in check, rising charge-offs, bankruptcies and extensive modified loan balances point to signs that all is far from well. There is what I call positive delinquency reductions and what I call negative delinquency reductions.
A positive delinquency reduction is one where the borrower pays current. By payment, the old-fashioned way.
Then there are negative delinquency reductions. These are created by charge-off and repossession liquidations. These negatively impact portfolio performance.
In my humble opinion, loan modifications are merely band aids on bullet holes and based upon these numbers, they appear to be over utilized and will eventually come back to bite credit unions who are over reliant on them sooner rather than later.
Following a rough 2024, the credit union industry is definitely nowhere near out of the woods.
Download the Data Here!
Best of luck!
Kevin Armstrong
Publisher
–
Related Articles;
Q1 2025 Credit Union Auto Loan Delinquency – Buckle Up Buttercup
Q4 2024 Credit Union Auto Loan Delinquency – An Ugly Year
The Calm Before the Storm – 1st Quarter 24’ Credit Union Auto Loan Delinquency
Credit Union Auto Loan Delinquency Climb Continues
Credit Union Auto Loan Delinquency Surges
Credit Union Auto Loan Delinquency Pattern Back to Normal
Q2 2025 Credit Union Auto Loan Delinquency – A Slow but Rising Tide – Q2 2025 Credit Union Auto Loan Delinquency – A Slow but Rising Tide – Q2 2025 Credit Union Auto Loan Delinquency – A Slow but Rising Tide
Q2 2025 Credit Union Auto Loan Delinquency – A Slow but Rising Tide – NCUA – Delinquency – Lending – Credit Union Collections – Credit Union Collectors – Repossession – Wholesale – Auto Loan


More Stories
Half the Credit Unions, Double the Pressure: The New Reality of Collections
Chinese National’s Identity Theft Scheme Nets Porsche, Maserati—and Prison Time
Are Auto Loan Delinquencies Getting You Down?