


TransUnion February 2026 Credit Industry Snapshot – 2022 & 2023 Vintages Spell Sustained Issues
–
March 20, 2026 — Auto lenders received modestly encouraging news this month, but vintage-level analysis from TransUnion warns that recovery pipelines will remain busy well into 2027.Consumer-level serious delinquencies improved slightly month-over-month, according to the latest TransUnion Credit Industry Snapshot.
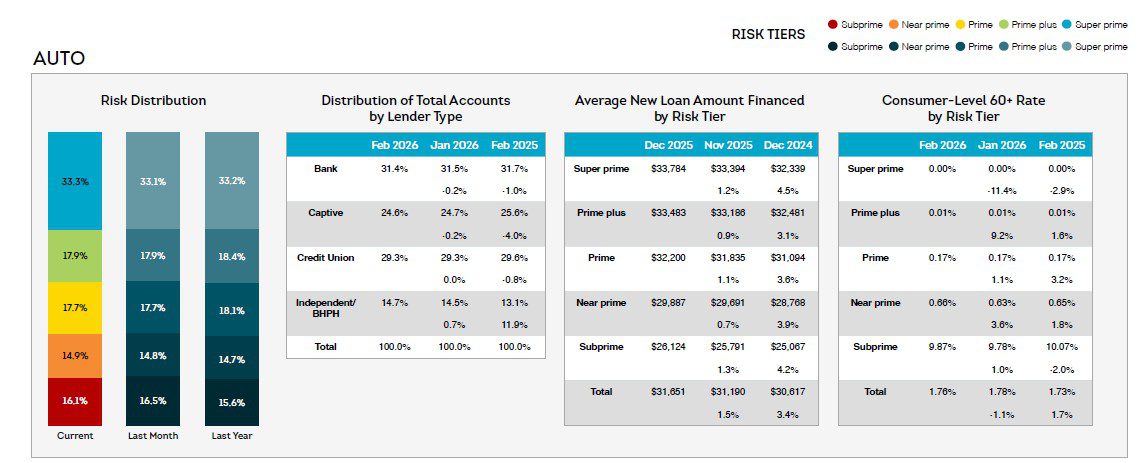
The percentage of consumers 30+ DPD dropped 19 basis points to 4.53%, while 60+ DPD fell 2 basis points to 1.76%. Average new loan amounts financed rose to $31,651 (from $31,190), reflecting continued high vehicle prices and larger originations.
Risk-tier distribution stayed relatively stable, with Super Prime consumers comprising 33.3% of the portfolio, followed by Prime Plus (17.9%), Prime (17.7%), Near Prime (14.9%), and Subprime (16.1%).
Read the Entire Report Here
–
Delinquency rates varied sharply by lender type (account-level):
- Credit Unions: 2.58% (30+ DPD) / 0.99% (60+ DPD) — lowest overall
- Captive finance: 2.87% / 0.97%
- Banks: 4.43% / 1.70%
- Independent/BHPH: 7.99% / 3.33% — highest by a wide margin
This means buy-here-pay-here and independent dealer portfolios will continue feeding a disproportionate share of repossession assignments.
–
Geographic Hotspots Demand Focused Resources
State-level consumer 30+ DPD rates highlight clear regional priorities for recovery teams. The highest concentrations were:
- Mississippi: 8.18%
- Louisiana: 7.38%
- District of Columbia: 7.30%
- Georgia: 6.68%
- Alabama: 5.79%
Lower-risk states (under 3.0%) such as Minnesota (2.49%), Idaho, Maine, and Oregon offer comparatively lighter operational pressure. Collections managers should continue concentrating field resources and early-intervention efforts in the Southeast and Gulf Coast.
–
Vintage Delinquency Trends: The Real Story for Repossession Volume
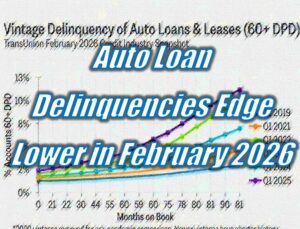
The report’s vintage curves (60+ DPD by months on book, Q1 2019–Q1 2025; 2020 vintages removed for pre-pandemic comparison) reveal why collections and repossession activity is unlikely to slow dramatically anytime soon.
The Q1 2019 vintage remains the healthy benchmark, with delinquencies rising gradually to only ~9% after 78 months. In sharp contrast:
- Q1 2022 (light green) and Q1 2023 (dark green) vintages show dramatically steeper ramps, already exceeding the lifetime delinquency levels of the 2019 book by 30–36 months on book. The 2022 vintage is currently the weakest, approaching 11–12% at 42–45 months.
- These cohorts — originated during peak vehicle prices, high rates, and widespread negative equity — are now entering their highest-risk seasoning window (33–45 months).
- Newer Q1 2024 (cyan) and Q1 2025 (purple) vintages are tracking noticeably better, offering early evidence that tighter underwriting is beginning to pay off.
–
Industry Implications for Collections & Repossession Teams
While headline delinquency rates are easing slightly, the vintage data tells a more complex story:
- Sustained volume ahead — Expect steady-to-elevated repossession assignments through 2026 and into 2027 as 2022–2023 books continue aging.
- Targeted segmentation — Prioritize originations by vintage year, with aggressive early collections on 2022–2023 loans.
- Geographic focus — Double down on high-delinquency states (MS, LA, GA, AL) and subprime/near-prime segments.
- Lender-type opportunities — Independent/BHPH portfolios will generate the highest assignment volume; captive and credit-union accounts will require less intensive follow-up.
- Proactive monitoring — Keep close watch on 2024–2025 vintages to prevent them from repeating the 2022–2023 pattern.
“Overall rates are moving in the right direction, but the vintage curves are the real signal for our industry,” noted one senior collections executive reviewing the TransUnion data. “Teams that segment by origination year and geography will be best positioned to manage recovery pipelines efficiently.”
The TransUnion February 2026 report provides collections and repossession leaders with clear marching orders: celebrate the modest national improvement, but double down on the high-risk vintages, states, and lender segments that will drive the majority of recovery activity for the next 12–24 months. Full state-by-state and lender-type tables are available in the report for granular operational planning.
Read the Entire Report Here
Auto Loan Delinquencies Edge Lower in February 2026 – Auto Loan Delinquencies Edge Lower in February 2026 – Auto Loan Delinquencies Edge Lower in February 2026
Auto Loan Delinquencies Edge Lower in February 2026 – Repossess – Repossession – Repossession Agency – Repossessor – Repossession – Credit Union Collections – Credit Union Collectors – Lending – Auto Loan – TransUnion – TransUnion – Delinquency – Subprime Auto Loans – Subprime Auto Loans


More Stories
Identity Vampires Prey on Vulnerable Elders
Free Webinar: How Credit Unions Can Modernize Operations with the Right Tech Partner
Free Webinar: The Death of Digital Transformation in Lending in 2026