


Market Insights – 1/10/2023
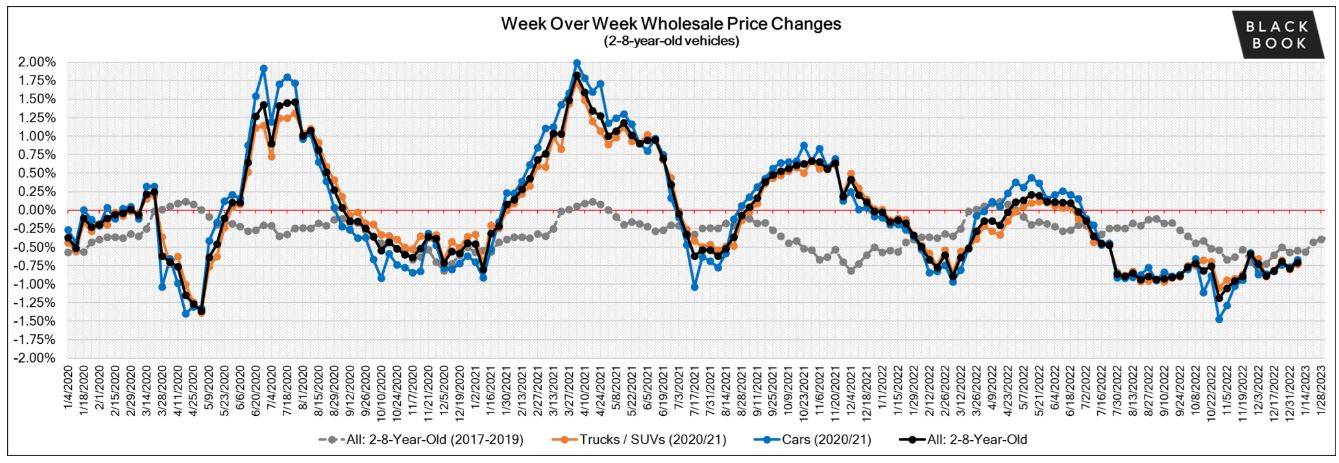
Wholesale Prices, Week Ending January 7th
With 2022 fully in the rearview mirror, we can begin to evaluate the years performance: the overall market finished down 22.9%, with Cars down 22.7% and Trucks down 23%. Full-Size Van was the only segment to see continued appreciation last year, up 3.2% after increasing 42.7% in 2021.
| This Week | Last Week | 2017-2019 Average (Same Week) | |
| Car segments | -0.67% | -0.77% | -0.60% |
| Truck & SUV segments | -0.73% | -0.80% | -0.50% |
| Market | -0.71% | -0.79% | -0.54% |
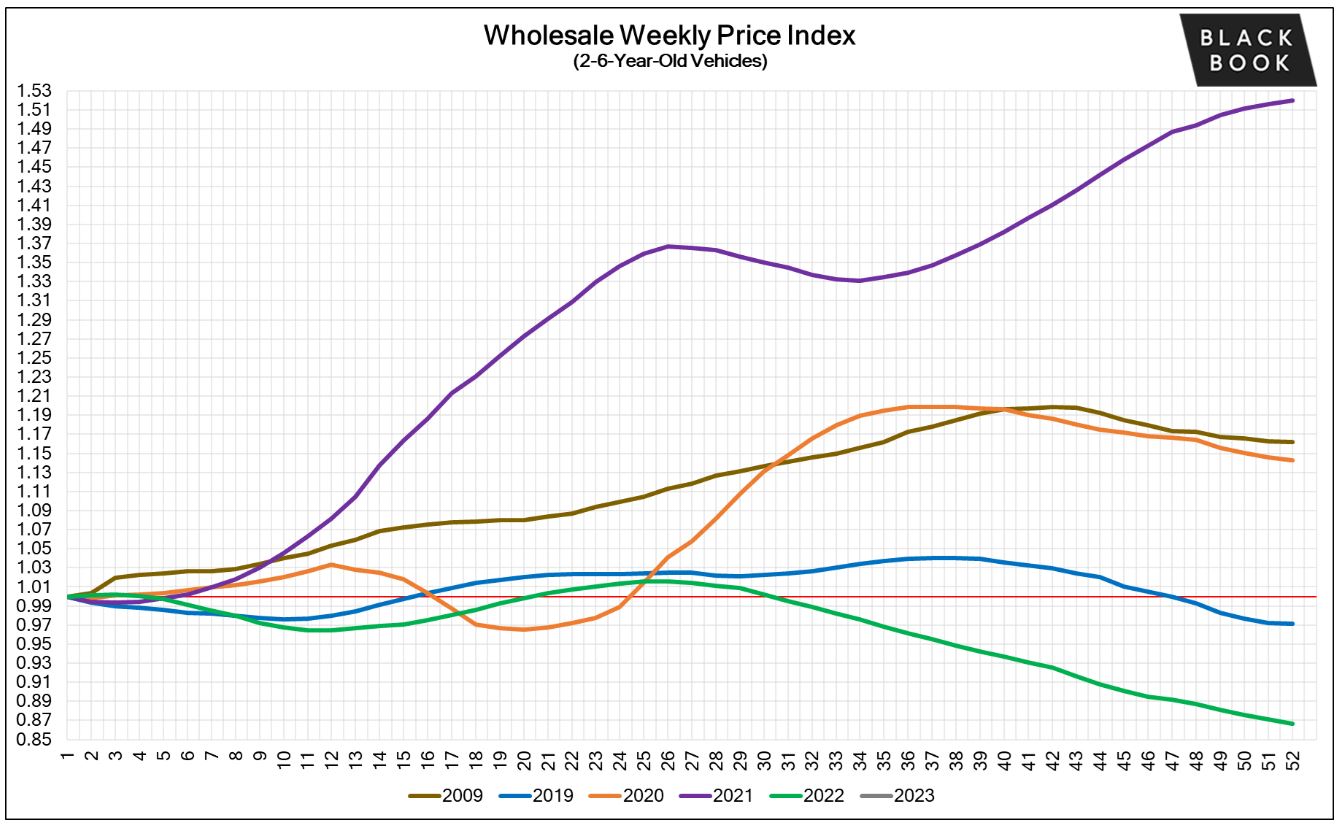
Weekly Wholesale Index
Calendar year 2020 and 2021 ended with used wholesale prices at elevated levels. With economic patterns (including the automotive market) driven by the pandemic, normal seasonal patterns (e.g., 2019 calendar year) in the wholesale market were not observed for most of the last three years.
We saw a similar picture in 2009, at the end of the Great Recession. Calendar year 2021 did not have typical seasonality patterns as the market had rapid increases in wholesale values for most of the year.
The Wholesale Weekly Price Index reached the highest point of the year at the end of December 2021, reporting over 1.51 points. In 2022, the price index was on a mild rollercoaster until July after which point prices where on a continuous decline until the end of the year.
The graph below looks at trends in wholesale prices of 2-6-year-old vehicles, indexed to the first week of the year. The index is computed keeping the average age of the mix constant to identify market movements. As we start 2023, the index sits at one after the end of the first full week of the year.
Used Retail Prices
Used Retail Prices are more accessible than in years past, due to the proliferation of ‘no-haggle pricing’ for used-vehicle retailing. Transparent pricing upfront makes the car buying process more enjoyable for customers and allows Black Book to accurately measure retail market trends.
At the on-set of the pandemic, in CY2020, used retail prices increased slightly, following typical seasonal patterns, and then began dropping in April, finally hitting a low point in the late spring months. By late summer of CY2020, Used Retail Prices increased as supply of new vehicle inventory started to become scarce, but retail demand slowed down at the end of CY2020, resulting in declining retail asking prices for the last several weeks of the year.
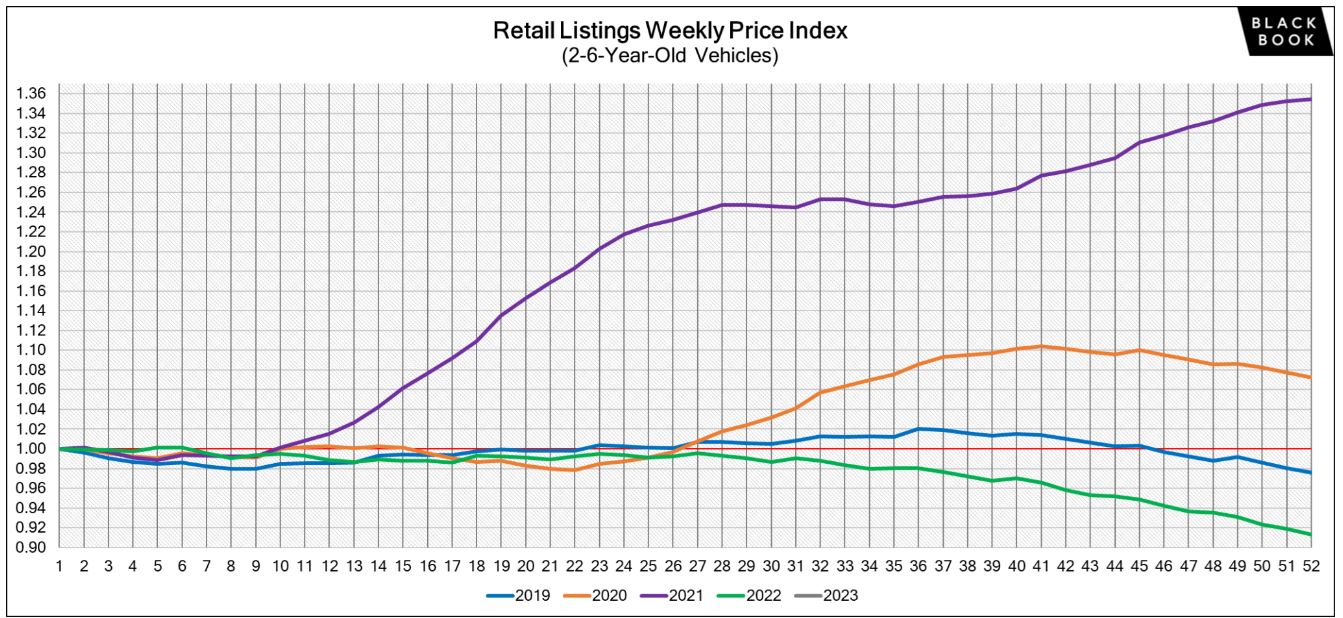
When CY2021 kicked off, demand rebounded while retail prices lagged slightly behind wholesale prices; March of 2021 started the dramatic increases in Used Retail Prices, fueled by stimulus payments, tax season, and shortages of new inventory. During the third quarter, retail prices continued to rise at a slower rate but soon picked up the pace once again to start the fourth quarter.
In Q4, prices on retail listings steadily increased week after week. As CY2021 came to an end, the retail listing price index closed 36% above where the year began. The index has remained relatively stagnant through most of CY2022. In the fourth quarter of 2022, the Retail Listings Price Index declines started, but not as steep as the wholesale price index.
This analysis is based on approximately two million vehicles listed for sale on U.S. dealer lots. The graph below looks at 2-6-year-old vehicles. The Index is computed keeping the average age of the mix constant to identify market movements. As we finished the first full week of 2023, the index reset back to one.
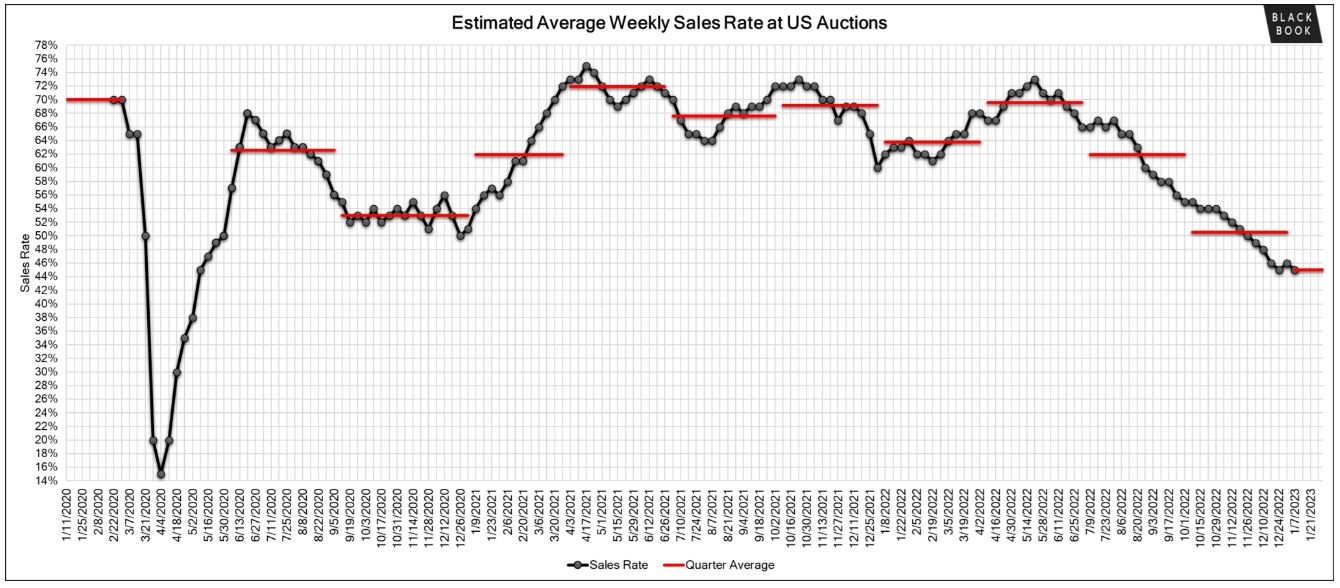
The Estimated Average Weekly Sales Rate came in at 45% last week.
Download this Market Insight
Black Book – Wholesale Index Rollercoaster Starts All Over Again – Black Book – Wholesale