


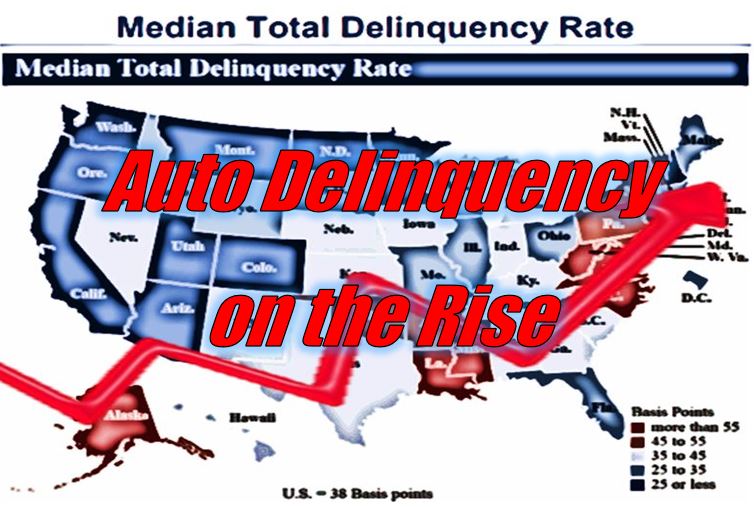
NCUA releases Q2 delinquency stats by state
Better late than never, the National Credit Union Administration finally released their aggregated delinquency number by state. As mentioned in August’s article titled “The mythical repossession explosion, and the real data“, the data is a little aged, but does show increases at or above pre-pandemic levels.
Highlights from the NCUA data;
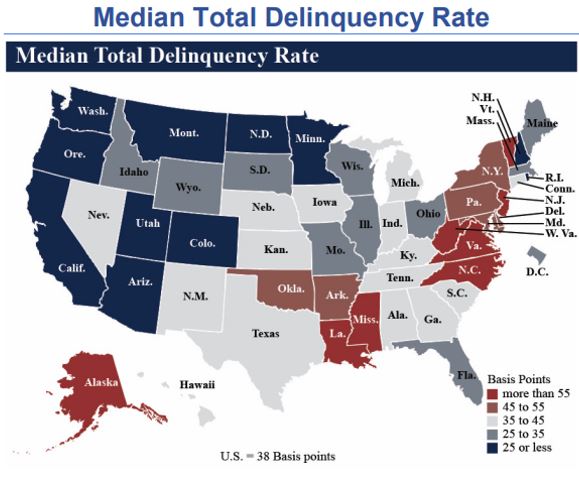
• At the end of the second quarter of 2022, the median total delinquency rate among federally insured credit unions was 38 basis points, compared with 33 basis points in the second quarter of 2021.
• At the end of the second quarter of 2022, the median delinquency rate was highest in New Jersey (87 basis points) and Mississippi (76 basis points).
• The median delinquency rate was lowest in Utah (12 basis points) and New Hampshire (15 basis points) at that time.
This really is an “apples to oranges” comparison when held up against the New York Fed’s Household Debt and Credit Report, which reported reportable national auto delinquency at 1.81%.
The NCUA is combining all delinquencies and not just autos. So, I dug into the actual data to see what autos are doing in the credit union portfolios.
Balances
Banks and finance companies have been slowly backing out of the auto lending market via higher interest rates and tighter underwriting, but credit unions have been filling that gap.
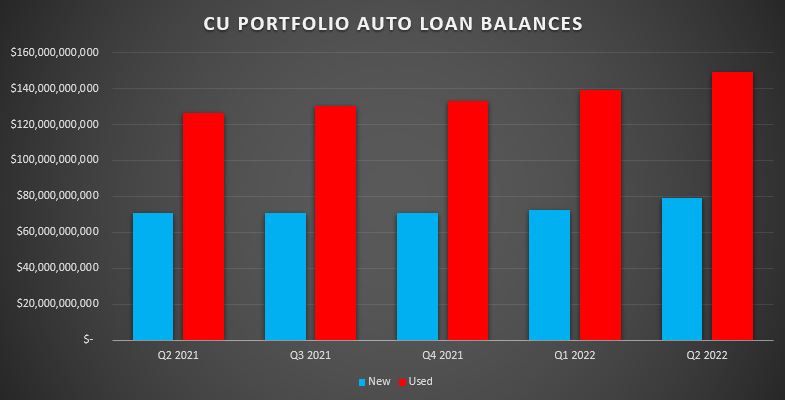
Credit union portfolio balances of new auto loans rose $8.2B year over year as of the end of Q2, 2022 while their used auto loan portfolios have grown $22.5B over the same period.
The used car area is probably a little overstated as much of this is comprised of refinances and these loans could already be well seasoned and not as susceptible to the dreaded 18-month window of highest default probability.
Delinquency
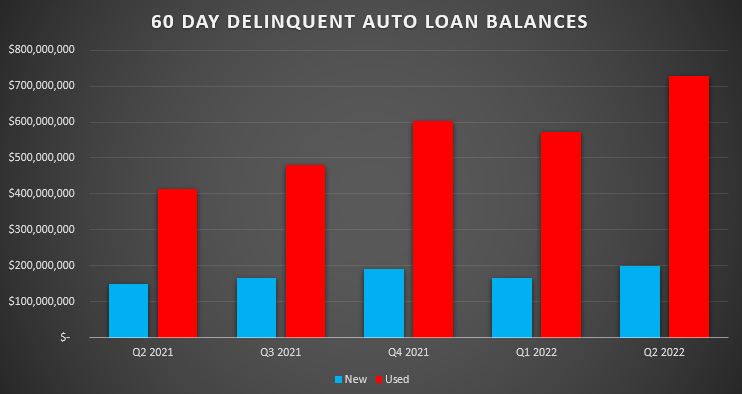
Reportable delinquency, 60 days delinquent and higher, is really where the story unfolds.
Year over year, reportable delinquency in new auto loans has risen $30.7M (+24%). But most noticeable is the change from Q1 to Q2 balance increase which has risen from $167M to $197M, an 15% increase in just 3 months.
This increase sits well above the Q4 totals which are typically the highest delinquency period of a year due to seasonality.
Used autos were up 44% year over year and 21% higher when comparing Q1 vs. Q2.
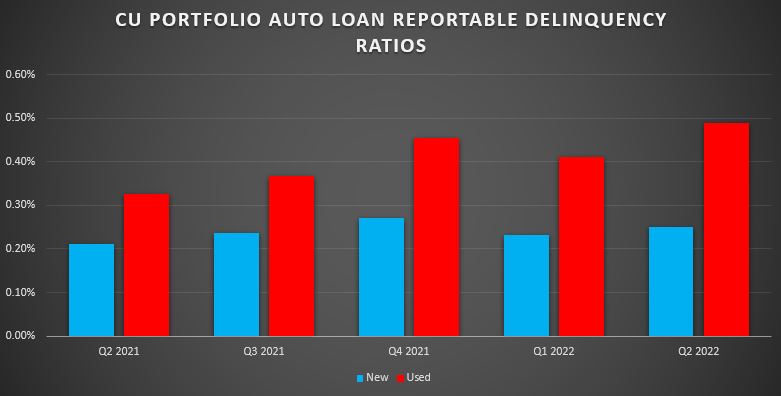
From a balance standpoint, these numbers are dramatic, but from a ratio standpoint, they are nominal. But also keep in mind, they are set against some high increases in loan originations. Origination numbers that have only increased over Q3. While these loan origination numbers soften the ratios, they plant the seeds for future delinquency ripe with their own issues, namely equity and stressed payment to income ratios.
What’s coming up
Obviously, these numbers are low when compared to peak delinquency eras, like during the Great Recession. But ask anyone in collections and they’ll tell you that auto loan delinquency is rising.
Ask anyone in auto lending and there is a sense of panic as inventory appears low and prices and interest rates rise. Panic that has many people biting off a lot more than they may be able to sustain in a high inflation era with a probable recession coming.
What may be coming is the bursting of a vehicle valuation bubble when inventories rise. This influx of additional collateral into the auction market could create dramatic decreases in auto loan values.
Decreases that psychologically demotivate borrowers from maintaining their negative equity valued vehicles. This in turn leads to higher volumes of defaults and voluntary repossessions and the vicious circle begins.
Nothing is carved in stone, but I expect that by Q1 2023, these rises in delinquency will garner greater attention to delinquency, collections and repossessions than we’ve seen in many years.
Kevin Armstrong
Publisher