


Coming off of the much needed 1st quarter 2024 delinquency reduction in auto loans, we knew it was to be short lived, and it was. With Q2 finally getting published by the National Credit Union Administration in their aggregate credit union 5300 FPR financials report, we can see that we’re almost right back to where 23’ finished. And charge off, well it’s getting ugly.
As has become the norm, National Credit Union Administration (NCUA) released their aggregate credit union 5300 FPR financials report almost three weeks before the end of the next quarter. But, better late than never. And with what has been reported, it is clear that the climb in loan delinquency that follows the 1st quarter is in full swing.
Download the Data Here!
Portfolio Balances
Even if the credit union industry had managed to hold their portfolio balances in check, delinquency ratios in Q2 24’ would have risen. But, with their combined balances dropping from $491B to $490B, the impact of the seasonal rise in auto loan delinquency in Q2 Is even more dramatic.
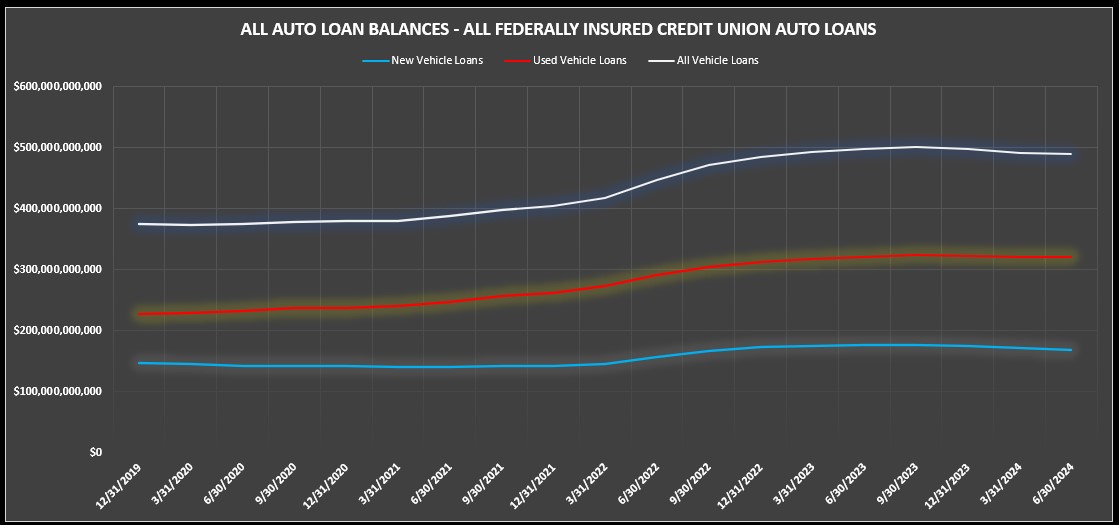
While only a minor blip in things, new auto loan balances reduced from $171B to $168B, a 1% reduction. This shows just how bad the combined impact of poor sales combined with manufacturer promotional rates and discounts have impacted auto loan balances. While this reduction is fairly benign, its impact on portfolio credit quality is telling. Delinquency ratios on new autos are almost half of those of used.
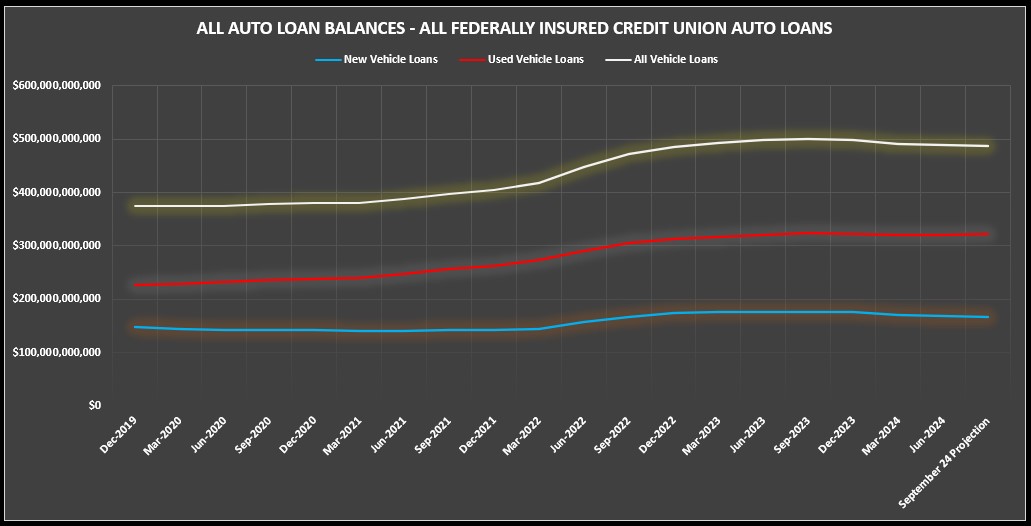
With the auto industry having a rough summer and credit unions continuing to suffer from low auto loan production, there is no reason to believe we are in for a long trend in production. Even if lenders could outrun rising delinquency ratios by high loan production, it’s just not going to happen this year. I predict another 1% drop in portfolios balances by the end of Q3.
30 Day Delinquencies
With the seasonal drop in delinquency experienced in Q1 well behind us, I had predicted that 30-day auto loan delinquencies would finish Q2 at a combined used and new auto balance of $6.8B with a ratio of 1.38%. Well, I was almost spot on. The delinquency ratio finished at 1.39% and $6.8B.
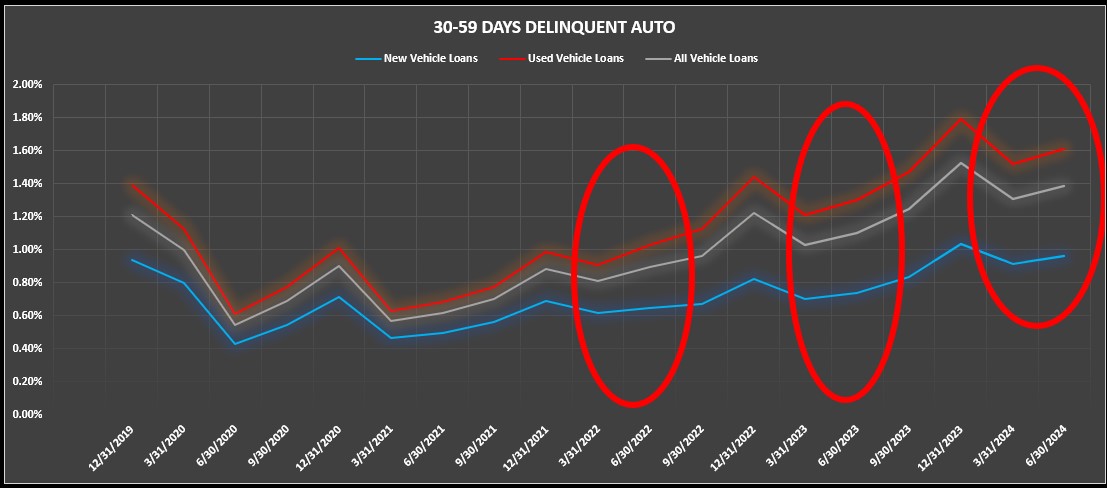
In Q3 of 2023, we saw this bucket rise by $775M, a 14% increase from Q2. Assuming similar results, I could be wrong, but I predict we will see a similar increase and finish Q3 at $7.2B with a delinquency ratio of 1.54%. While this category isn’t the primetime number of reportable delinquency, it is the canary in a coal mine of what is to come.
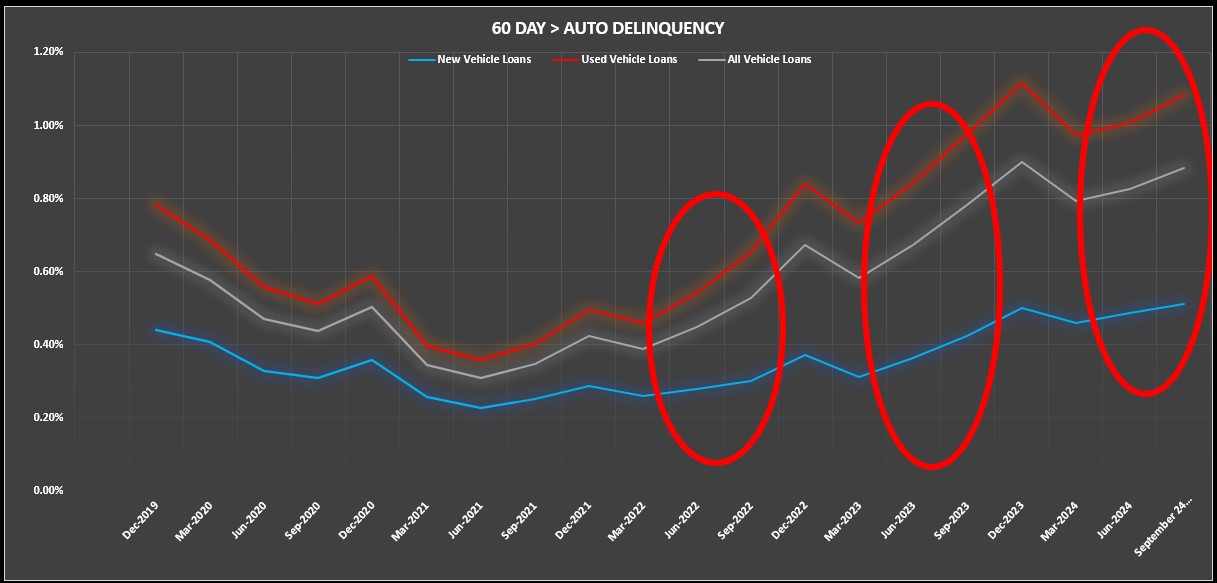
60 Day + Delinquencies
Reportable delinquency; the big show in delinquency, the heart of all repossession activity and the spawn of charge off losses. Last June I had predicted that the 2nd quarter’s delinquency would finish almost back to where 23’ had ended at $4.3B with a delinquency ratio of 0.90%.
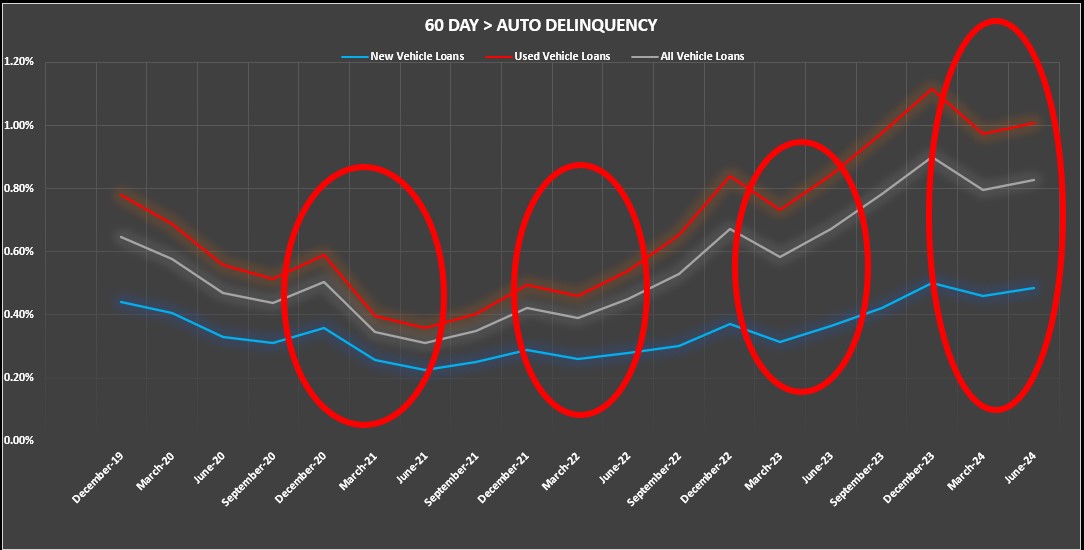
As it turns out, I was way off! It only rose by $145M. With a delinquency ratio of 0.83% it was almost held flat. I suspect there is some reason for this, but I’ll get to that later in this article.
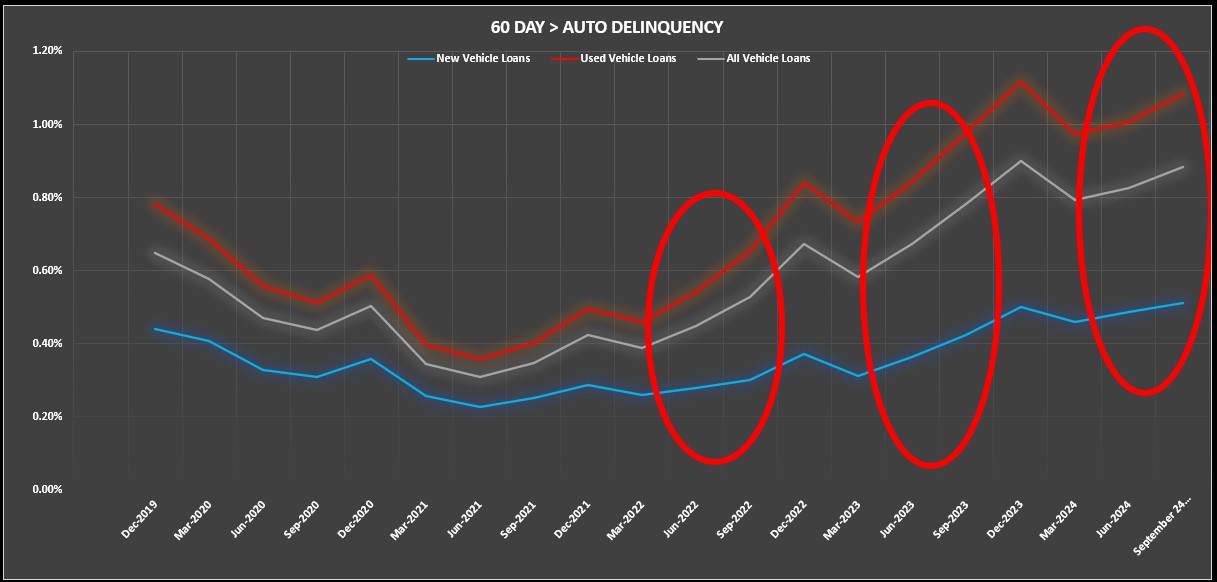
Undaunted by my failure, I will again stick my head out there and maintain the seasonal average as the best source of assumption and predict that Q3 reportable delinquency will finish at $4.4B with a ratio of 0.92%, almost right where 2023 ended.
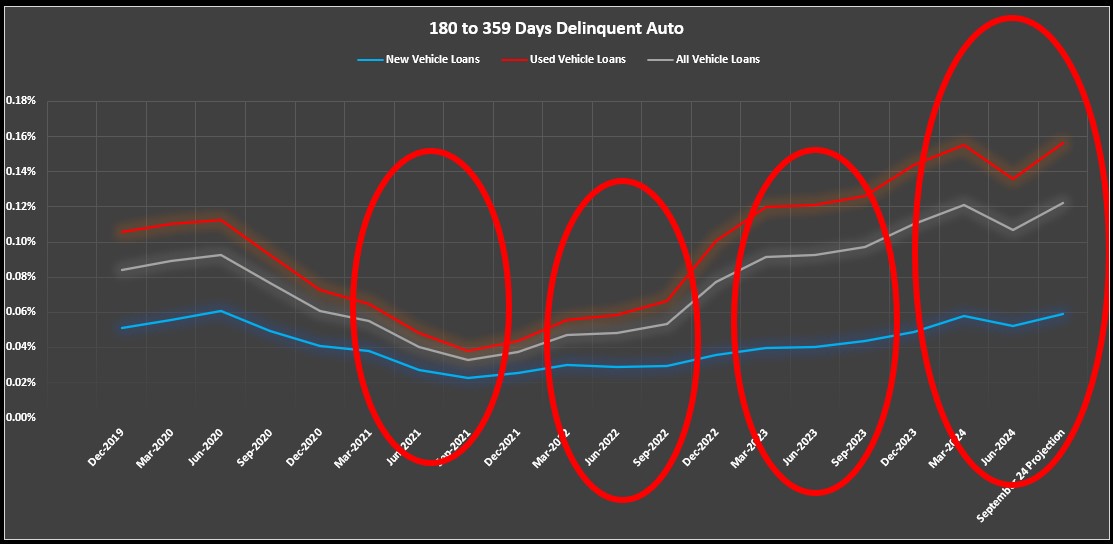
180+ Days Delinquent
Pretty much everything over 180-days delinquent in auto loans is dead meat. It’s charge off is inevitable and it’s reductions are drawn primarily through liquidated repossessions and charge off. Last June I had predicted that the 2nd quarter would finish at $606M with a ratio of 0.12%. It was again much lower than I projected and finished at $524M with a ratio of 0.11%.
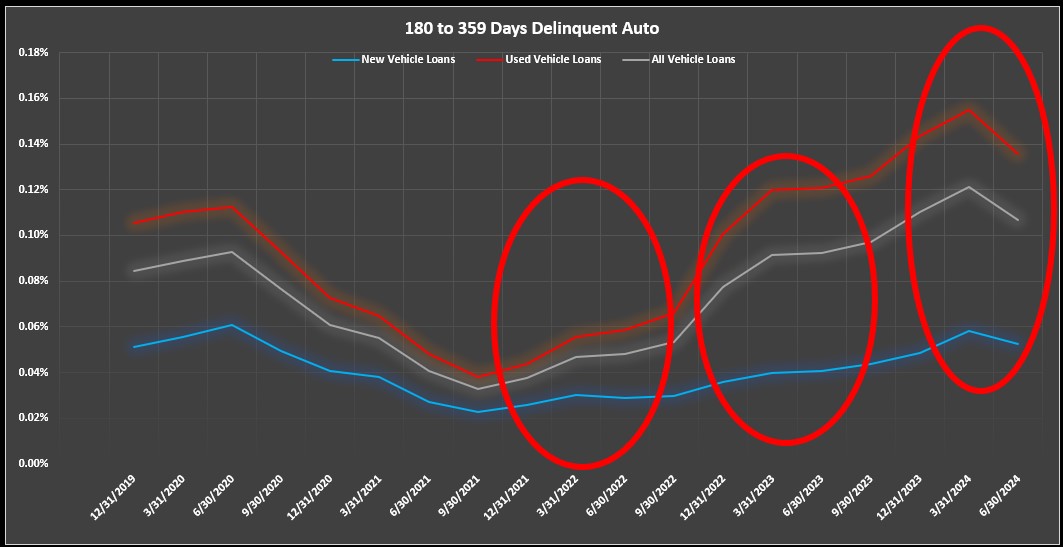
For Q3, I predict that we will see a spike with an 18% increase to $622M with a ratio of 0.12%. As previously mentioned, if portfolio balances decrease, the ratio will be heavily affected. As mentioned, charge off plays a major role in the substance and balances in this category and as you are about to see, there appear to be some major changes going on out there.
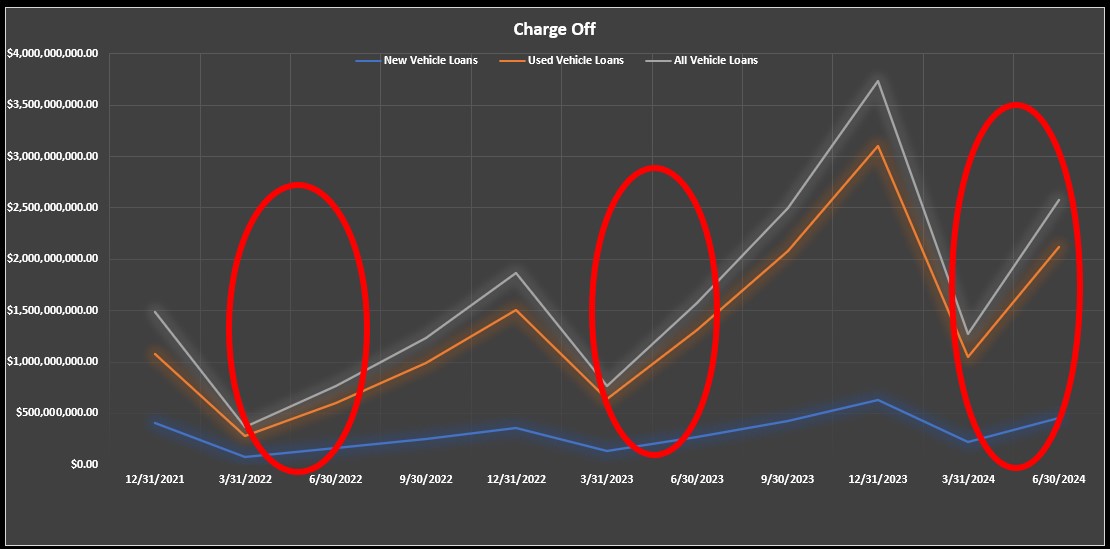
Charge-Off
I haven’t really dived very deep into charge off in my past years delinquency reporting and projections, but I noticed something rather startling in Q2’s reporting. Gross combined auto loan charge-off for Q2 finished at $7.5B from q1’s $3.8B. This is almost where it was at the end of Q3 of 2023. I predict that by the end of Q3, we will see it at at least $3.5B. That’s almost as high as the whole previous year with an additional higher quarter too go.
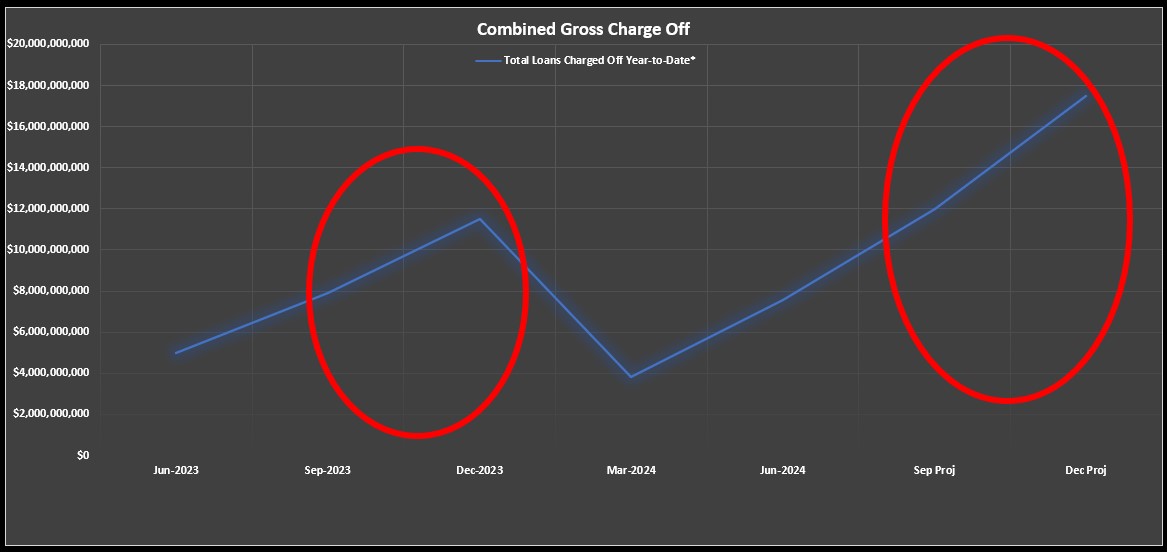
Overall portfolio charge off is getting man handled by unsecured loans as well and If this trend of 50%+ quarter over quarter continues, we will exceed Q4’s cumulative $11.5B by the end of Q3. If resumed, it will explode to an estimated $17.5B by year end! Time will tell if this trend of enhanced charge off levels continues, but it is impacting delinquency ratios, especially in the aforementioned reportables and 180 day + delinquency tranches.
Summary
Unless you’re working in a closed segment credit union whose members are sheltered by government employment, you are probably feeling the strain of this rising delinquency in ways you may not have experienced since the Great Recession. However, since the Great Recession ended over a decade ago, you are probably in a minority in the collections world.
As we muddle through the softening economy, we will likely see some rises in unemployment that will bring many of these predictions to fruition. As it is, even with softer inflation numbers, people are struggling.
While credit union Visa card balances dropped during the 1st quarter of 24’, mostly from tax refunds and annual bonuses, they climbed back up to Q4’s $82B by the end of Q2. But delinquency in this product will probably climb by another $2B a quarter throughout the rest of the year.
First mortgages are beginning to show signs of stress as well. Q2 finished at $3.5B in reportables with a delinquency ratio of h%. This is the highest it has been since the NCUA began offering the aggregate reports.
These are not the signs of a healthy economy. These are the signs of an economy struggling to stay above water.
And while we suffer through another election cycle, we have a press that keeps us distracted from these facts with the usual political bilge. Reality has again become politicized and it’s not a convenient time to discuss the struggling state of the economy for some.
They keep reporting of the strength of the economy but, for those of us up to our necks in it, we can see the truth. It’s not getting better in the lending world and even with the Fed preparing to lower prime rate, it’ll be band aids on bullet holes for the damage already done.
Kevin Armstrong
Publisher
Related Articles;
The Calm Before the Storm – 1st Quarter 24’ Credit Union Auto Loan Delinquency
4th Quarter 24’ Credit Union Auto Loan Delinquency at Record Levels
Credit Union Auto Loan Delinquency Climb Continues
Credit Union Auto Loan Delinquency Surges
Credit Union Auto Loan Delinquency Pattern Back to Normal
NCUA Data Shows Auto Loan Delinquency About to Explode – NCUA Data Shows Auto Loan Delinquency About to Explode – NCUA Data Shows Auto Loan Delinquency About to Explode
NCUA Data Shows Auto Loan Delinquency About to Explode – NCUA – Delinquency – Lending – Credit Union Collections – Credit Union Collectors – Repossession – Wholesale – Auto Loan


More Stories
Half the Credit Unions, Double the Pressure: The New Reality of Collections
Chinese National’s Identity Theft Scheme Nets Porsche, Maserati—and Prison Time
Are Auto Loan Delinquencies Getting You Down?