


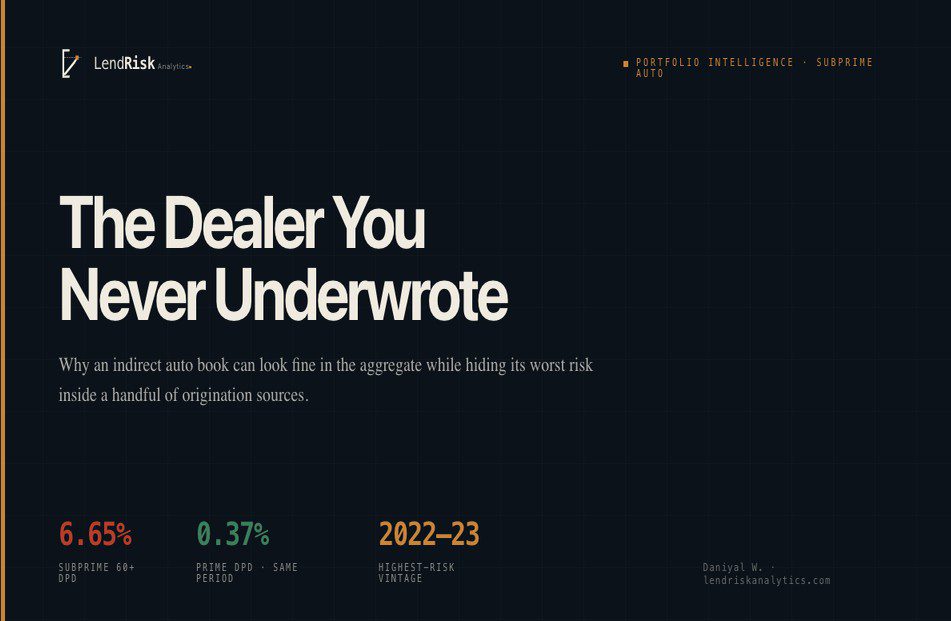
Why an indirect auto book can look fine in the aggregate while hiding its worst risk inside a handful of origination sources.
–
In indirect auto, losses are usually explained through the borrower. Thin credit. Soft income. A weak vehicle. Missed payments. All of that can be true, but it often puts the cause too late in the chain.
By the time a borrower misses the third payment, the risk may have already been created months earlier by a party the lender never truly underwrote: the dealer who originated the deal.
The application that reaches the lender is not always raw. It has been shaped. The income figure may clear DTI by just enough. The down payment may not be as clean as it looks. The collateral value may not hold up when the vehicle comes back through auction. That is origination behavior.
Kevin Armstrong has written that this cycle is history repeating itself, and I think that is the right frame. Straw deals, inflated income, weak collateral, disappearing cosigners none of this is new. What has changed is that the data to identify the pattern is often sitting inside the lender’s own portfolio, and many mid-market institutions still are not cutting the book that way.
–
The aggregate is a weighted blur
Pull the indirect auto book and look at the blended numbers. Most of the time, nothing looks extreme.
Reuters reported that Fitch data showed 6.65 percent of subprime auto borrowers were at least 60 days delinquent in October 2025, the highest level in Fitch’s data going back to the early 1990s. Prime borrowers, by contrast, were at 0.37 percent.
Against that backdrop, a subprime or near-prime book that looks close to the market average can feel explainable. The board sees a familiar number. The conversation moves on.
But a blended average only tells you where the middle of the book sits. It does not tell you which loans are pulling the average in either direction.
That is where the risk hides.
Sort the same book by the originating dealer. The picture changes quickly. In many indirect portfolios, the damage is rarely spread evenly. A small group of dealers can account for a disproportionate share of severe delinquency, early payment default, and charge-off exposure.
Early payment default is especially useful because it is one of the cleanest signals that the deal was impaired when it was written. If one dealer’s borrowers are missing inside the first three payments at several times the network median, that is an origination-quality issue at a specific source.
Your loss curve may be a dealer-selection story wearing a borrower’s name.
–
Where the truth shows up
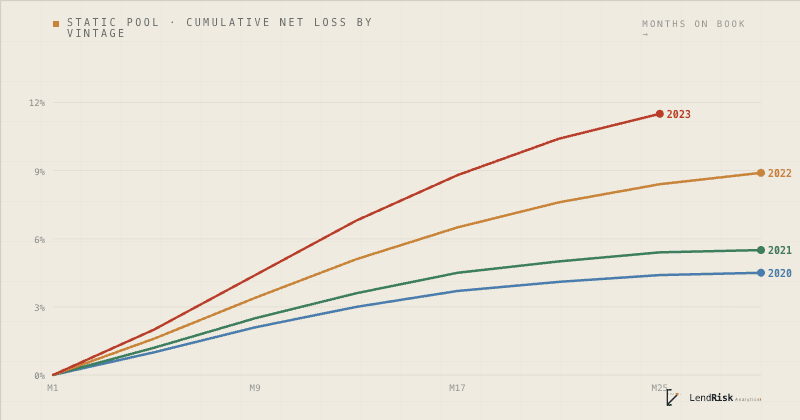
Static pool analysis is where this becomes hard to ignore.
Group loans by origination quarter. Break the pools by credit tier. Track cumulative loss, delinquency, and roll rates by months on book. Then add dealer as a source field.
That view tells you more than the aging report ever will.
The 2022 and 2023 vintages are a useful example. Those loans were written during a period of inflated used-car values, stretched payments, and credit profiles that were often stronger on paper than in practice. As those vintages season, the weak cohorts become visible first in roll rates, then in 90-day delinquency, then later in charge-offs and recoveries.
That timing matters.
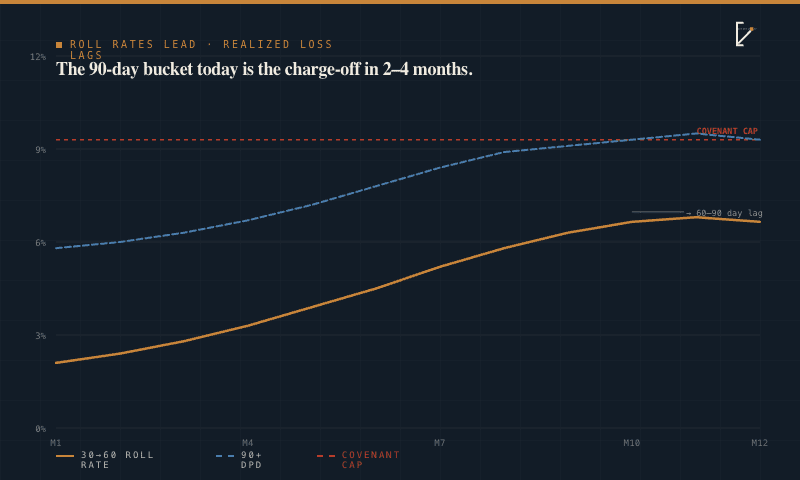
Roll rates lead. Net loss lags.
The 90-day bucket today is often the charge-off two to four months from now. The realized loss comes later, after recovery, auction proceeds, and deficiency balance realities settle in. A lender watching only the aging report is usually reacting to a problem that started a quarter earlier.
A lender watching dealer-level vintage curves sees the issue sooner.
The hard part is that many mid-market lenders and credit unions do not track third-party originations this way. They may know delinquency by credit tier. They may know delinquency by month. They may know overall charge-offs. But they do not always trace the problem back to dealer source, vintage, and early-payment behavior together.
That is the missing view.
–
The asymmetry
The largest lenders can afford dedicated teams for portfolio analytics, risk monitoring, and dealer-performance attribution. They have people whose job is to understand where performance is changing before it appears in the aggregate.
A smaller credit union or regional auto lender may have the same exposure without the same infrastructure.
The data is usually there. The problem is that it is not always organized around the question that matters most:
Which origination sources are producing the risk?
This is not always a software gap. In many cases, the first useful answer lives in two consecutive monthly snapshots, a clean dealer field, and a disciplined roll-rate view.
The institutions that get surprised are not always missing data. They are often missing the cut of the data that shows where the risk is concentrating.
–
What to look at before the examiner asks
Credit unions may not answer to a warehouse bank, but they still answer to examiners, CECL reserves, board oversight, and internal credit discipline.
All of those reward the same thing: knowing where loss is forming before it shows up fully in the aggregate.
Three cuts can change the conversation:
1. Rank dealers by performance, not volume.
Look at net loss per dollar originated, early payment default rate, severe delinquency, and charge-off migration. The highest-volume dealer is not always the highest-risk dealer, and the lowest-volume dealer is not always harmless.
2. Build static pools by origination quarter and credit tier.
Compare each cohort against older vintages at the same seasoning point. If a newer cohort is running materially worse than prior vintages, that is not noise. That is next year’s loss beginning to form.
3. Run roll rates every month.
Two consecutive monthly snapshots can show how loans are migrating from current to 30, 60, and 90+ days past due. That transition view gives management a forward-looking read on charge-off pressure before it appears in realized loss.
Once the deterioration is named precisely, that it is this dealer, this vintage, this credit band, this term structure. The response can also be precise.
You do not have to tighten the entire book because three dealers are producing bad paper. You can pause specific sources, adjust advance or term rules, review documentation quality, and protect the healthy part of the program.
The aggregate may say the book is fine.
The static pool may say three dealers have already decided otherwise.
That gap between the number being reported and the slope underneath it is where the work begins.
—
Daniyal W
Founder, LendRisk Analytics
lendriskanalytics.com
daniyal@lendriskanalytics.com
(703) 910-1093
Daniyal W. is the founder of LendRisk Analytics, an independent portfolio-risk analytics practice for credit unions, mid-market auto lenders, and BHPH operators. LendRisk helps lenders clean loan tapes and break portfolio performance down by dealer, vintage, and credit tier using lender-provided data. Engagements are private, flat-fee, and conducted under NDA.