


Steady increases in U.S. auto debt over the past seven years have raised concerns over credit quality and delinquency in consumers’ repayment. We investigate these concerns and find that the credit quality of auto debt has actually improved throughout the current expansion. Delinquency rates have been rising mostly among subprime borrowers, who represent about a quarter of total outstanding auto debt. However, the potential risks to the financial sector are currently unknown and warrant close monitoring.
Kansas City, MO – 15 August 2018 – Auto delinquency rates have been climbing over the past few years, raising concerns about deteriorating credit quality and unsustainable growth in auto debt. While delinquency rates have not yet reached their prior peak in 2010, they are increasing at a time of economic expansion, tighter labor markets, and higher wages. In the event of an economic downturn, these delinquency rates could increase further. Compounding these concerns, auto debt has been rising nearly uninterrupted since the third quarter of 2011, reaching $1.06 trillion (in 2010 dollars) by the second quarter of 2018 (Chart 1). Auto debt currently accounts for a little over 9 percent of total U.S. consumer debt, up from 6 percent in the third quarter of 2011.
Chart 1: Real Auto Debt Outstanding
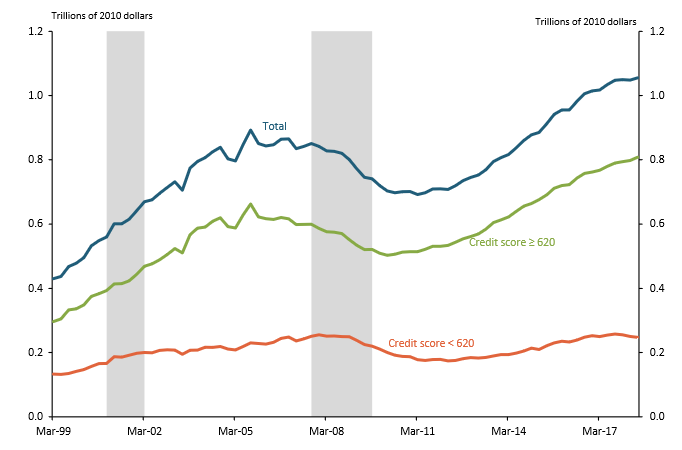
Note: Gray bars denote National Bureau of Economic Research (NBER)-defined recessions.
Sources: Federal Reserve Bank of New York Consumer Credit Panel/Equifax and NBER.
However, the rising level of auto debt may not be a cause for concern if it is driven by creditworthy borrowers. We use microdata from the Federal Reserve Bank of New York Consumer Credit Panel/Equifax to examine the trends in auto debt and delinquency rates by borrower type. Chart 1 shows that the rise in auto debt has been driven largely by prime borrowers (those with credit scores 620 or above). In contrast, the rise in auto delinquency rates appears to have been driven largely by subprime borrowers (those with credit scores below 620). Chart 2 plots the overall auto delinquency rate from 1999 to 2018, using the industry standard of 90+ days without payment to measure delinquency. Although the overall auto delinquency rate (blue line) began to rise in 2015, this rise appears to be driven largely by subprime borrowers (orange line). Delinquency rates among subprime borrowers rose from 12.4 percent in 2015 to 16.3 percent by the second quarter of 2018. Over the same period, the average delinquency rates of prime borrowers, who account for the bulk of outstanding auto debt, were essentially unchanged, fluctuating between 0.3 and 0.4 percent. Together, these results suggest there has not been a substantial change in the risk profile of auto debt.
Chart 2: Auto Delinquency Rates (90+ Days Delinquent)
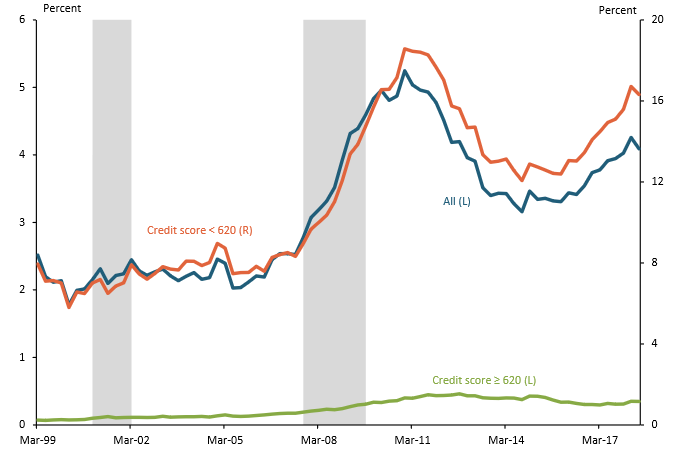
Note: Gray bars denote NBER-defined recessions.
Sources: Federal Reserve Bank of New York Consumer Credit Panel/Equifax and NBER.
In fact, average credit quality has increased. Chart 3 shows that the average credit score of consumers with newly issued auto debt has risen steadily since the Great Recession, as the share of subprime borrowers (those with credit scores below 620) in total outstanding auto debt has declined. Subprime borrowers currently hold less than 24 percent of the debt.
Chart 3: Average Credit Score of Consumers with New Auto Debt and Subprime Share of Total Auto Debt
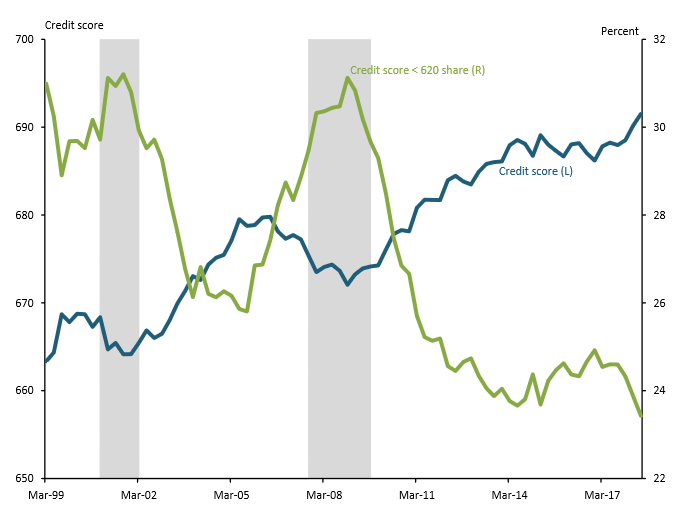
Note: Gray bars denote NBER-defined recessions.
Sources: Federal Reserve Bank of New York Consumer Credit Panel/Equifax and NBER.
Nevertheless, a rise in subprime delinquencies might be concerning if it is widespread rather than the result of a shock to a particular sector or area of the economy. To examine this, we sort subprime borrowers based on their county of residence using measures of county-level industry dependence constructed by the U.S. Department of Agriculture (USDA). Chart 4 shows that the national pattern holds regardless of a county’s major industry. Specifically, the chart shows that auto delinquency rates among subprime borrowers increased everywhere during and immediately following the Great Recession.
Chart 4: Subprime Auto Delinquency Rates by County Typology
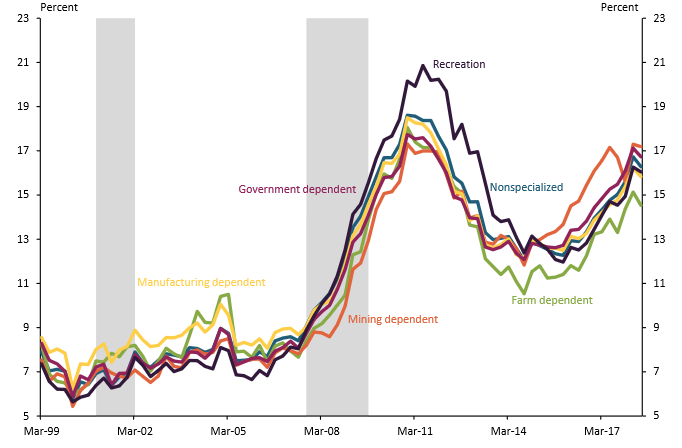
Note: Gray bars denote NBER-defined recessions.
Sources: Federal Reserve Bank of New York Consumer Credit Panel/Equifax, NBER, and USDA.
Shortly after the recession, subprime delinquency rates were highest in recreation-dependent areas, presumably because demand for recreation remained low. However, since 2015, subprime delinquency rates have been highest among mining-dependent counties, possibly due to the collapse of oil prices that began in the second half of 2014. Despite these minor variations, no specific region of the country stands out as a main contributor of the increase in delinquency rates between the fourth quarter of 2015 and the second quarter of 2018.
Furthermore, although subprime borrowers account for a relatively low share of auto debt, their borrowing may still pose some risk to the auto financing sector. Chart 5 reports the shares of newly issued auto debt for prime and subprime borrowers by institution type—specifically, banks, credit unions, and auto financing companies. Solid lines represent the shares for subprime borrowers, while dashed lines represent the shares for prime borrowers. In the fourth quarter of 2017, auto financing companies issued 44 percent of prime debt. In contrast, auto financing companies have issued approximately 66 percent of subprime debt since 2010. Auto financing companies may be more willing to lend to subprime borrowers—and therefore take on more risk—than other institutions, as they are better positioned to place a repossessed vehicle within their network of auto dealers.
Chart 5: Share of Newly Issued Auto Debt by Loan Industry
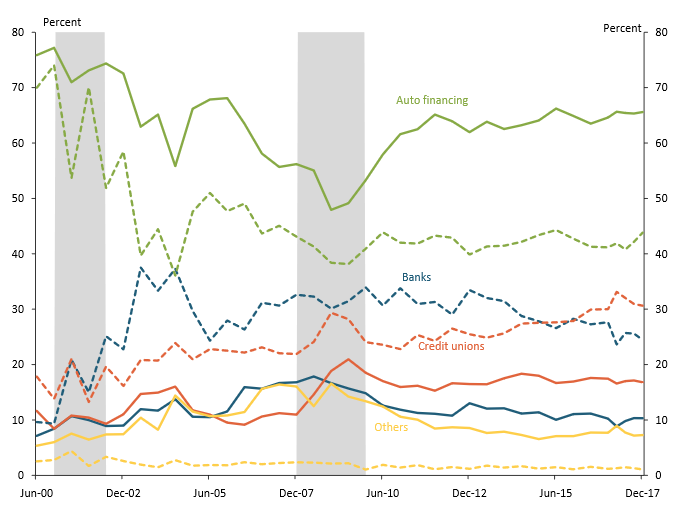
Note: Solid lines represent credit scores < 620 and dashed lines represent credit scores ≥ 620. Gray bars denote NBER-defined recessions.
Sources: Federal Reserve Bank of New York Consumer Credit Panel/Equifax and NBER.
Overall, rising auto debt and delinquency rates do not yet appear to pose major risks to the auto sector or the macroeconomy. Subprime borrowers represent less than a quarter of outstanding auto debt as of the second quarter of 2018, and average credit quality has been increasing since the Great Recession. However, the potential risks to the financial sector from rising auto delinquency rates among subprime borrowers warrant continued monitoring should credit quality begin to ease or economic and employment growth slow.
Jason P. Brown is an assistant vice president and economist at the Federal Reserve Bank of Kansas City. Colton Tousey is a research associate at the bank. The views expressed are those of the authors and do not necessarily reflect the positions of the Federal Reserve Bank of Kansas City or the Federal Reserve System.
Source: Federal Reserve Bank of Kansas City
Auto Loan Delinquency Rising, But Mostly in Subprime Borrowers – Auto Loan Delinquency Rising, But Mostly in Subprime Borrowers – Auto Loan Delinquency Rising, But Mostly in Subprime Borrowers – Auto Loan Delinquency Rising, But Mostly in Subprime Borrowers – Auto Loan Delinquency Rising, But Mostly in Subprime Borrowers
Steady increases in U.S. auto debt over the past seven years have raised concerns over credit quality and delinquency in consumers’ repayment. We investigate these concerns and find that the credit quality of auto debt has actually improved throughout the current expansion. Delinquency rates have been rising mostly among subprime borrowers, who represent about a quarter of total outstanding auto debt. However, the potential risks to the financial sector are currently unknown and warrant close monitoring.
Kansas City, MO – 15 August 2018 – Auto delinquency rates have been climbing over the past few years, raising concerns about deteriorating credit quality and unsustainable growth in auto debt. While delinquency rates have not yet reached their prior peak in 2010, they are increasing at a time of economic expansion, tighter labor markets, and higher wages. In the event of an economic downturn, these delinquency rates could increase further. Compounding these concerns, auto debt has been rising nearly uninterrupted since the third quarter of 2011, reaching $1.06 trillion (in 2010 dollars) by the second quarter of 2018 (Chart 1). Auto debt currently accounts for a little over 9 percent of total U.S. consumer debt, up from 6 percent in the third quarter of 2011.
Chart 1: Real Auto Debt Outstanding
Note: Gray bars denote National Bureau of Economic Research (NBER)-defined recessions.
Sources: Federal Reserve Bank of New York Consumer Credit Panel/Equifax and NBER.
However, the rising level of auto debt may not be a cause for concern if it is driven by creditworthy borrowers. We use microdata from the Federal Reserve Bank of New York Consumer Credit Panel/Equifax to examine the trends in auto debt and delinquency rates by borrower type. Chart 1 shows that the rise in auto debt has been driven largely by prime borrowers (those with credit scores 620 or above). In contrast, the rise in auto delinquency rates appears to have been driven largely by subprime borrowers (those with credit scores below 620). Chart 2 plots the overall auto delinquency rate from 1999 to 2018, using the industry standard of 90+ days without payment to measure delinquency. Although the overall auto delinquency rate (blue line) began to rise in 2015, this rise appears to be driven largely by subprime borrowers (orange line). Delinquency rates among subprime borrowers rose from 12.4 percent in 2015 to 16.3 percent by the second quarter of 2018. Over the same period, the average delinquency rates of prime borrowers, who account for the bulk of outstanding auto debt, were essentially unchanged, fluctuating between 0.3 and 0.4 percent. Together, these results suggest there has not been a substantial change in the risk profile of auto debt.
Chart 2: Auto Delinquency Rates (90+ Days Delinquent)
Note: Gray bars denote NBER-defined recessions.
Sources: Federal Reserve Bank of New York Consumer Credit Panel/Equifax and NBER.
In fact, average credit quality has increased. Chart 3 shows that the average credit score of consumers with newly issued auto debt has risen steadily since the Great Recession, as the share of subprime borrowers (those with credit scores below 620) in total outstanding auto debt has declined. Subprime borrowers currently hold less than 24 percent of the debt.
Chart 3: Average Credit Score of Consumers with New Auto Debt and Subprime Share of Total Auto Debt
Note: Gray bars denote NBER-defined recessions.
Sources: Federal Reserve Bank of New York Consumer Credit Panel/Equifax and NBER.
Nevertheless, a rise in subprime delinquencies might be concerning if it is widespread rather than the result of a shock to a particular sector or area of the economy. To examine this, we sort subprime borrowers based on their county of residence using measures of county-level industry dependence constructed by the U.S. Department of Agriculture (USDA). Chart 4 shows that the national pattern holds regardless of a county’s major industry. Specifically, the chart shows that auto delinquency rates among subprime borrowers increased everywhere during and immediately following the Great Recession.
Chart 4: Subprime Auto Delinquency Rates by County Typology
Note: Gray bars denote NBER-defined recessions.
Sources: Federal Reserve Bank of New York Consumer Credit Panel/Equifax, NBER, and USDA.
Shortly after the recession, subprime delinquency rates were highest in recreation-dependent areas, presumably because demand for recreation remained low. However, since 2015, subprime delinquency rates have been highest among mining-dependent counties, possibly due to the collapse of oil prices that began in the second half of 2014. Despite these minor variations, no specific region of the country stands out as a main contributor of the increase in delinquency rates between the fourth quarter of 2015 and the second quarter of 2018.
Furthermore, although subprime borrowers account for a relatively low share of auto debt, their borrowing may still pose some risk to the auto financing sector. Chart 5 reports the shares of newly issued auto debt for prime and subprime borrowers by institution type—specifically, banks, credit unions, and auto financing companies. Solid lines represent the shares for subprime borrowers, while dashed lines represent the shares for prime borrowers. In the fourth quarter of 2017, auto financing companies issued 44 percent of prime debt. In contrast, auto financing companies have issued approximately 66 percent of subprime debt since 2010. Auto financing companies may be more willing to lend to subprime borrowers—and therefore take on more risk—than other institutions, as they are better positioned to place a repossessed vehicle within their network of auto dealers.
Chart 5: Share of Newly Issued Auto Debt by Loan Industry
Note: Solid lines represent credit scores < 620 and dashed lines represent credit scores ≥ 620. Gray bars denote NBER-defined recessions.
Sources: Federal Reserve Bank of New York Consumer Credit Panel/Equifax and NBER.
Overall, rising auto debt and delinquency rates do not yet appear to pose major risks to the auto sector or the macroeconomy. Subprime borrowers represent less than a quarter of outstanding auto debt as of the second quarter of 2018, and average credit quality has been increasing since the Great Recession. However, the potential risks to the financial sector from rising auto delinquency rates among subprime borrowers warrant continued monitoring should credit quality begin to ease or economic and employment growth slow.
Jason P. Brown is an assistant vice president and economist at the Federal Reserve Bank of Kansas City. Colton Tousey is a research associate at the bank. The views expressed are those of the authors and do not necessarily reflect the positions of the Federal Reserve Bank of Kansas City or the Federal Reserve System.
Source: Federal Reserve Bank of Kansas City
Read More!
Auto Loan Delinquency Rising, But Mostly in Subprime Borrowers – Credit Union Collections – Credit Union Collectors – Lending – Delinquency


More Stories
Auto Loan Fraud Losses Have Tripled, But the Number of Fraud Cases Is Falling
A Different Kind of Money Laundry
Federal Banking Agencies Issue New Guidance on Immigration-Related Credit Risk
18 Year Old Fraud Auto Loan “Credit Mule” Busted on Video
Lenders Continue Paying Millions to Settle TCPA Lawsuits as Decades-Old Telephone Law Collides with Modern Collections
Happy Birthday CUCollector! Seventeen Years… Where Did the Time Go?